


 |
| Gold V.1.3.1 signal Telegram Channel (English) |
EURUSD Technical & Fundamental Analysis: Breakdown Tests Critical 1.1400 Support
2026-03-20 @ 09:02
Over the past 24 to 48 hours, the EUR/USD pair has experienced significant downward pressure, closing yesterday at 1.1574. The pair has fallen sharply from the year-to-date high of 1.2080, hitting an intraday low near 1.1495, marking a seven-month trough, which underscores the euro’s weakening in recent sessions.
According to the latest market news, the euro’s decline is mainly driven by strong US dollar support coupled with surging energy prices in Europe. Europe’s heavy reliance on imported oil and liquefied natural gas, alongside growing geopolitical tensions, has undermined market confidence in the eurozone’s economic recovery prospects, pushing the euro lower. Meanwhile, resilient US economic data sustains the US dollar’s yield advantage, further bolstering its appeal.
This downtrend mirrors investor concerns regarding the European Central Bank’s (ECB) future policy path, especially with eurozone inflation cooling. Market expectations for a more dovish ECB stance are rising amid this backdrop. At the same time, the upcoming US Consumer Price Index (CPI) report is drawing intense focus, as it will influence the Federal Reserve’s rate decisions, causing traders to adjust their forex positions accordingly.
In summary, the recent EUR/USD movements and prevailing market sentiment highlight increased uncertainty in forex markets amid intertwined global economic and geopolitical factors. For investors holding euros or considering trading the pair, staying alert to forthcoming economic releases and central bank meetings is crucial to navigating potential turning points in the currency’s trajectory.

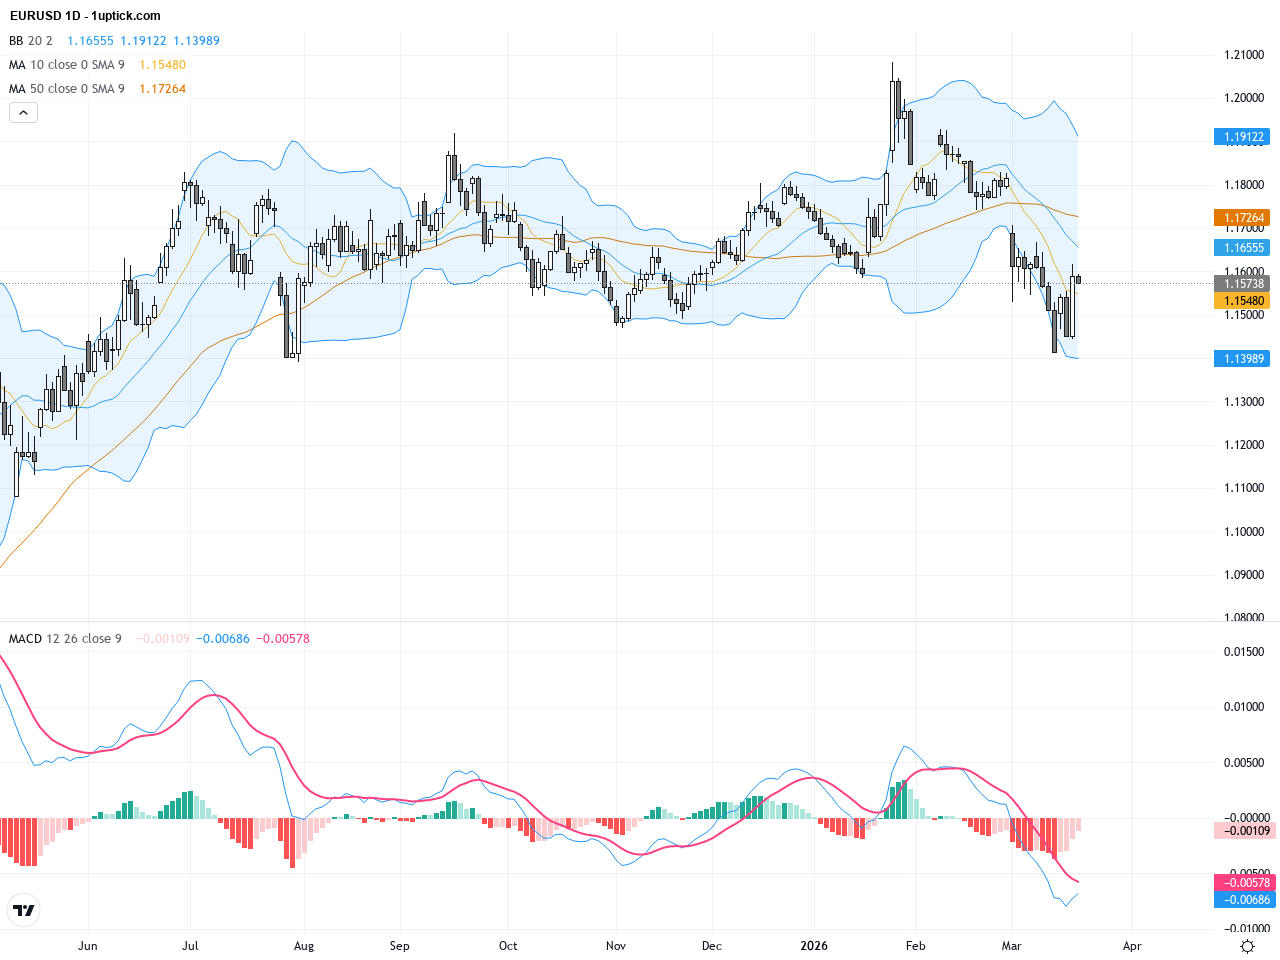
The daily chart reveals a clear downward trend, with EURUSD falling sharply from the YTD high of 1.2080 to around 1.1495. The price has decisively broken below both the 50-day moving average (~1.1750) and the 200-day moving average (~1.1682), indicating weakness across short and medium-term timeframes. Bollinger Bands have widened, signaling increased volatility. The MACD is in negative territory, with a bearish crossover, confirming strong selling momentum. Overall, the daily technical setup is bearish, with the 1.1400 support level now a critical watchpoint.

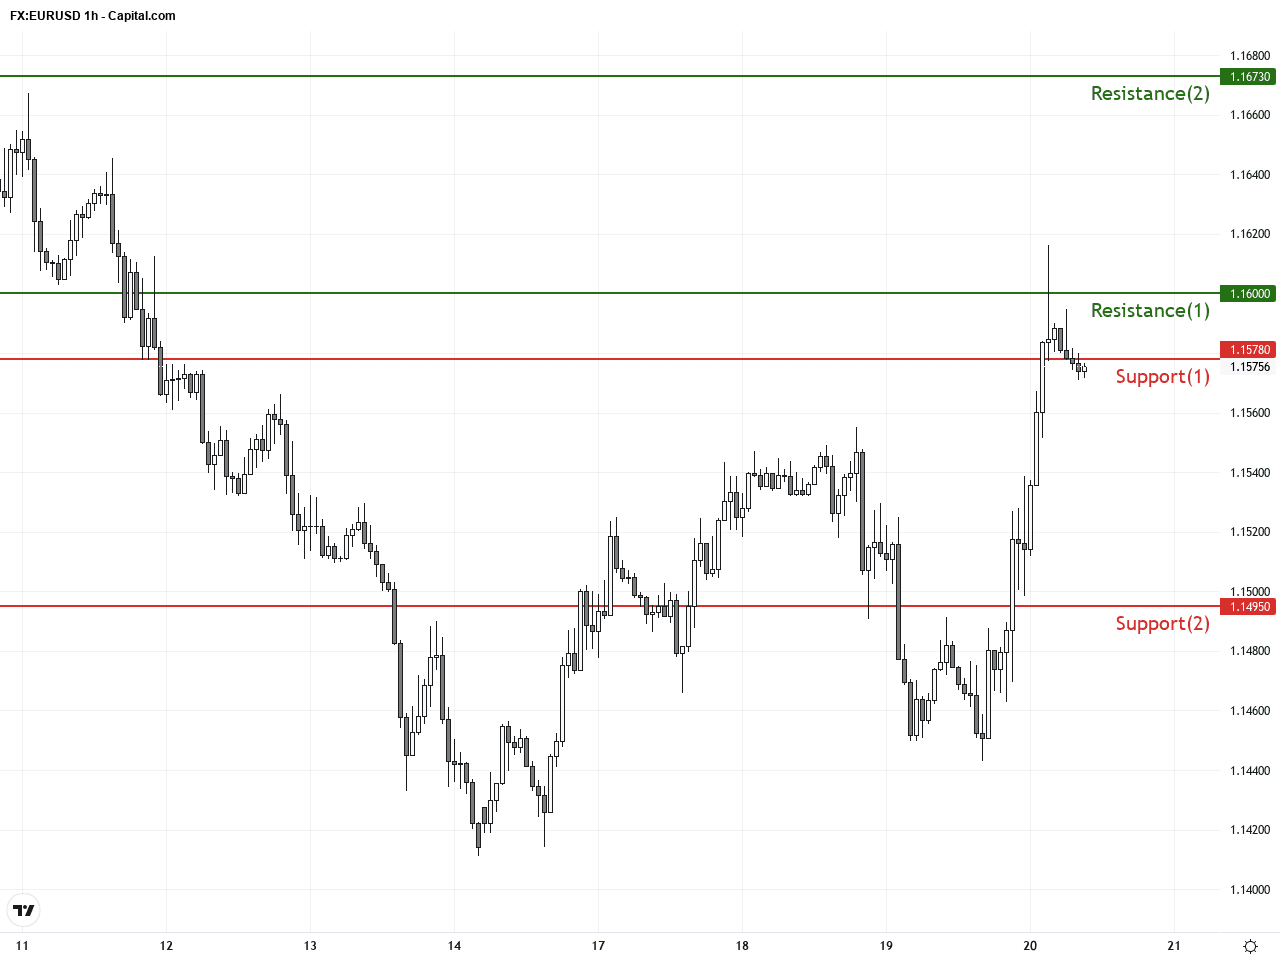
On the hourly chart covering the last 3-5 days, EURUSD repeatedly tested the 1.1578 level without major rebound. The price remains below the 20-hour moving average, with short-term moving averages forming a death cross—a bearish signal for near-term momentum. Bollinger Bands narrowed before expanding, indicating increasing price volatility. The MACD histogram has contracted but remains negative, while RSI stays near lows but not yet oversold, suggesting persistent selling pressure. Near term, further tests of key support are possible.
Technical Trend: Trend assessment: Decisively bearish.
Technically, EURUSD shows strong bearish momentum backed by a daily death cross and MACD negative signals. The hourly chart confirms persistent challenges holding key support levels with a clear descending triangle forming, hinting at continued downside pressure. The pivotal 1.1400 support level represents a significant inflection point. Traders should watch price action and volume closely to gauge the validity of this support, as a break could trigger accelerated selling. Risk management is paramount in the current environment.Today’s economic calendar features several EU data releases including trade balance and current account figures. Forecasts suggest a slight decline in trade surplus for January, unlikely to offer clear bullish or bearish catalysts for EURUSD. German producer price index data for February is also expected to show marginal improvement but may not shift market sentiment substantially. No major US economic releases are scheduled today that would impact EURUSD directly. The market focus remains on upcoming central bank decisions.
Resistance & Support
The above financial market data, quotes, charts, statistics, exchange rates, news, research, analysis, buy or sell ratings, financial education, and other information are for reference only. Before making any trades based on this information, you should consult independent professional advice to verify pricing data or obtain more detailed market information. 1uptick.com should not be regarded as soliciting any subscriber or visitor to execute any trade. You are solely responsible for all of your own trading decisions.