


 |
| Gold V.1.3.1 signal Telegram Channel (English) |
EURUSD Technical & Fundamental Outlook: Middle East Tensions Propel USD Strength, Euro Faces Continued Pressure
2026-03-04 @ 09:01
Over the past 24 to 48 hours, the EUR/USD exchange rate experienced a notable decline, dropping from yesterday’s close at 1.15935 to a low of 1.1530, reflecting intensified volatility. The main driver behind this price movement was escalating geopolitical tensions in the Middle East, which bolstered the US dollar’s safe-haven demand, despite the Eurozone’s recent inflation data showing an uptick.
The Eurozone’s consumer price index rose from 1.7% to 1.9%, with core inflation increasing from 2.2% to 2.4%, data that would normally support the euro. However, rising tensions in the Middle East, associated energy shocks, and a divergence in monetary policy stance between the Federal Reserve and the European Central Bank reinforced dollar strength, amplifying the euro’s decline. The EUR/USD even briefly fell below the key psychological level of 1.1600, adding to market jitters.
For investors, this episode highlights how geopolitical events can swiftly reshape currency market dynamics in a short timeframe. Even with solid inflation readings from Europe, the euro came under pressure as safe-haven flows supported the dollar. This serves as a reminder that inflation figures are not the sole factor influencing exchange rates; political risks and global economic outlooks remain critical in driving currency moves.

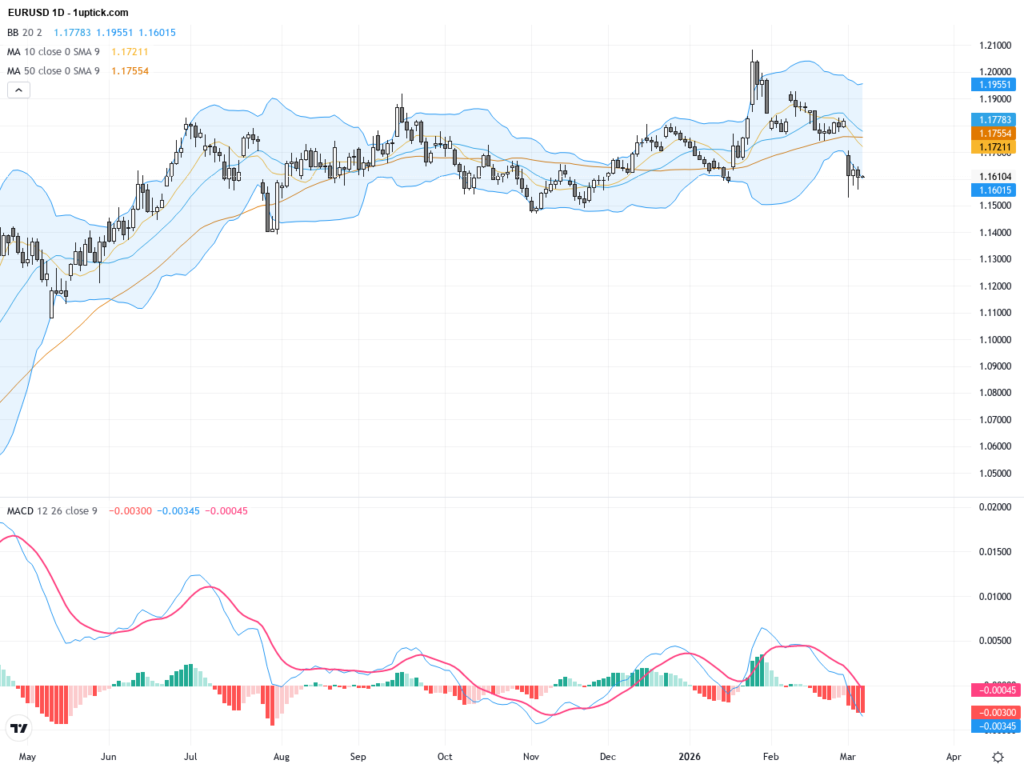
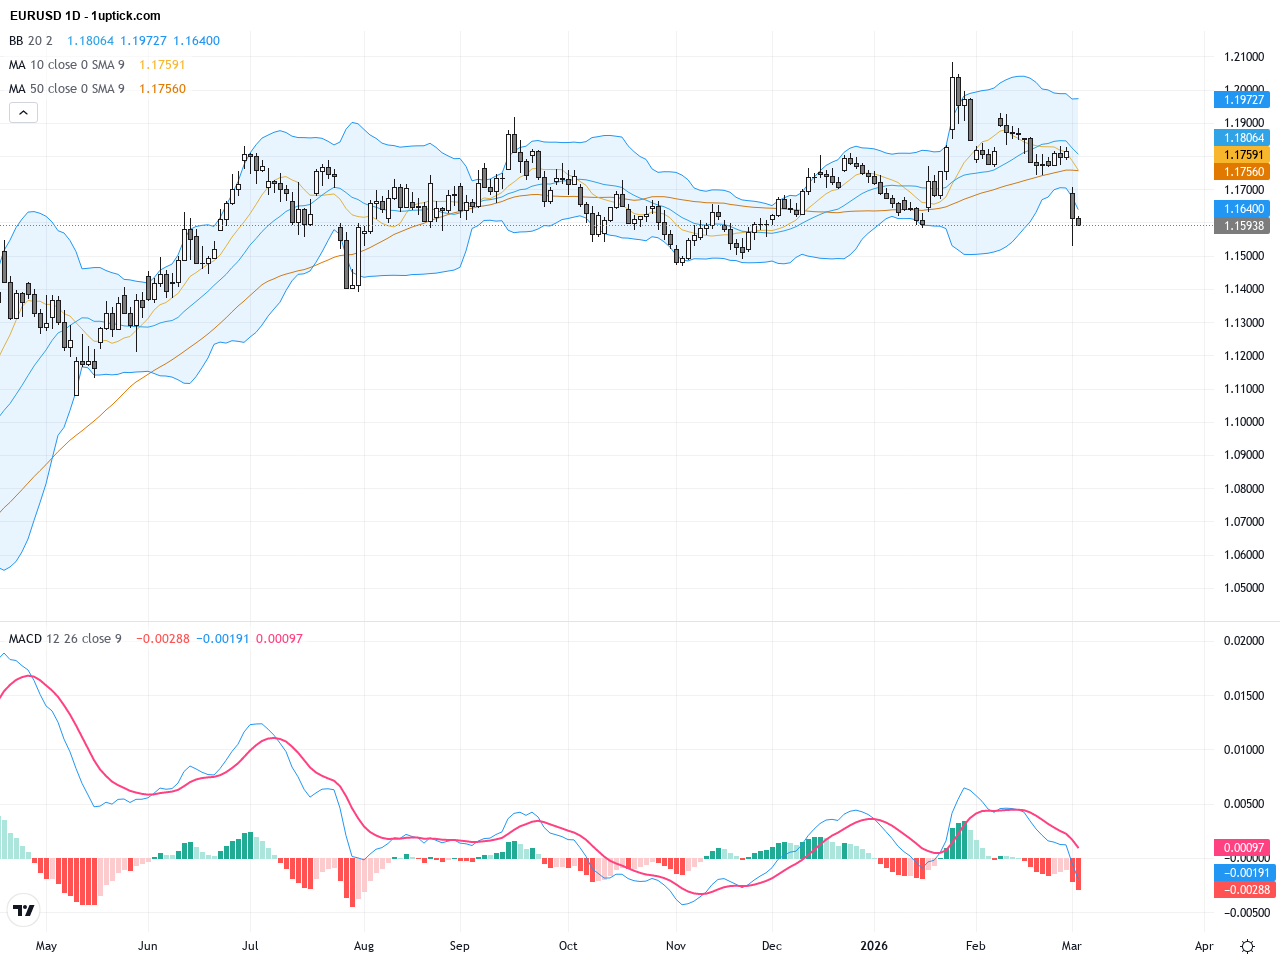
The EURUSD daily chart shows a clear downtrend from approximately 1.1850 highs, with price mostly below the 50-day moving average (1.17803) and nearing the 200-day moving average (1.16898) as key support, indicating a medium-term bearish bias. The widening Bollinger Bands signal increased volatility, with prices repeatedly touching the lower band, suggesting sellers dominate. The MACD remains negative and diverging further, reinforcing bearish momentum in the technical outlook.
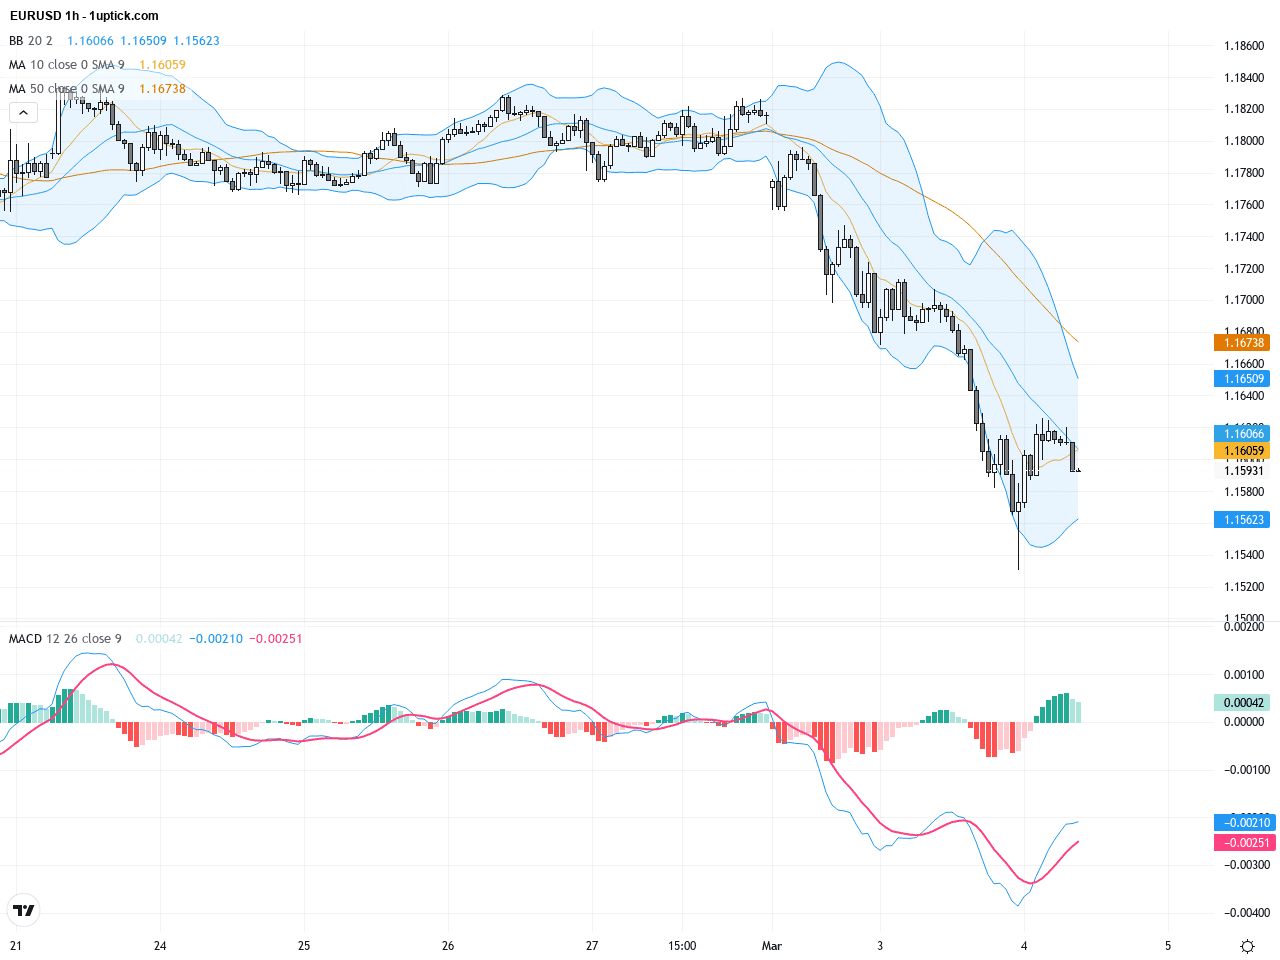
Looking at the hourly chart over the past five days, EURUSD ranges between 1.1530 and 1.1620 with frequent oscillations. Short-term moving averages (like the 20-period MA) slope downward, creating resistance near current price levels, while the middle Bollinger Band trends lower, hinting at potential renewed short-term declines. An imminent MACD bearish cross could amplify selling pressure. The recent bearish engulfing candle points to likely continued weakness in the next 24 hours.
Technical Trend: The overall trend is currently decisively bearish, with cautious downside risk dominant until stronger signals emerge from geopolitical or policy developments.
Technically, EURUSD sits at a critical support near 1.1530; a clear break below could accelerate downside risks. Daily MACD’s widening negative divergence signals strong bearish momentum supported by volume trends. The hourly chart shows a potential bearish setup with moving averages crossing and bearish engulfing candlesticks. Traders should monitor market reactions to ongoing Middle East tensions that bolster the dollar and await key resistance between 1.1600 and 1.1650 for possible reversal or breakout opportunities.Today’s economic calendar includes several key European services PMIs, expected to show modest stability or slight increases, providing some short-term support to the Euro. Meanwhile, the US ADP employment report forecast of 50k jobs hints at potential USD strength. Overall, no major direct events will decisively move EURUSD today, though ECB speakers and Eurozone data releases remain the main focus for market participants to gauge future direction.
Resistance & Support

The above financial market data, quotes, charts, statistics, exchange rates, news, research, analysis, buy or sell ratings, financial education, and other information are for reference only. Before making any trades based on this information, you should consult independent professional advice to verify pricing data or obtain more detailed market information. 1uptick.com should not be regarded as soliciting any subscriber or visitor to execute any trade. You are solely responsible for all of your own trading decisions.