


 |
| Gold V.1.3.1 signal Telegram Channel (English) |
GBPUSD Approaches Key Resistance at 1.3437 Ahead of UK February CPI Data
2026-03-25 @ 13:01
Over the past 24 to 48 hours, GBP/USD has hovered around the 1.34 level, opening near 1.3411 which is slightly above yesterday’s close of 1.3392, demonstrating mild volatility. The pound experienced sharp round-trip swings earlier this week but steadied as the market focused on the upcoming UK Consumer Price Index (CPI) release.
Rising geopolitical tensions and higher energy prices have driven demand for the US dollar, causing the pound to slip about 0.16%. The uptick in US Treasury yields has further supported the dollar, indirectly capping GBP/USD’s upside. Market participants are closely watching whether the Bank of England will maintain a hawkish stance amid persistent inflation pressures, a key influence on the pound’s trajectory.
For the everyday investor, this price action reflects a cautious market waiting on UK official inflation guidance while the US dollar shows safe-haven appeal amid global uncertainties. Major institutions like Bank of America have recommended selling GBP at current levels, highlighting ongoing risks relating to UK politics and economics.

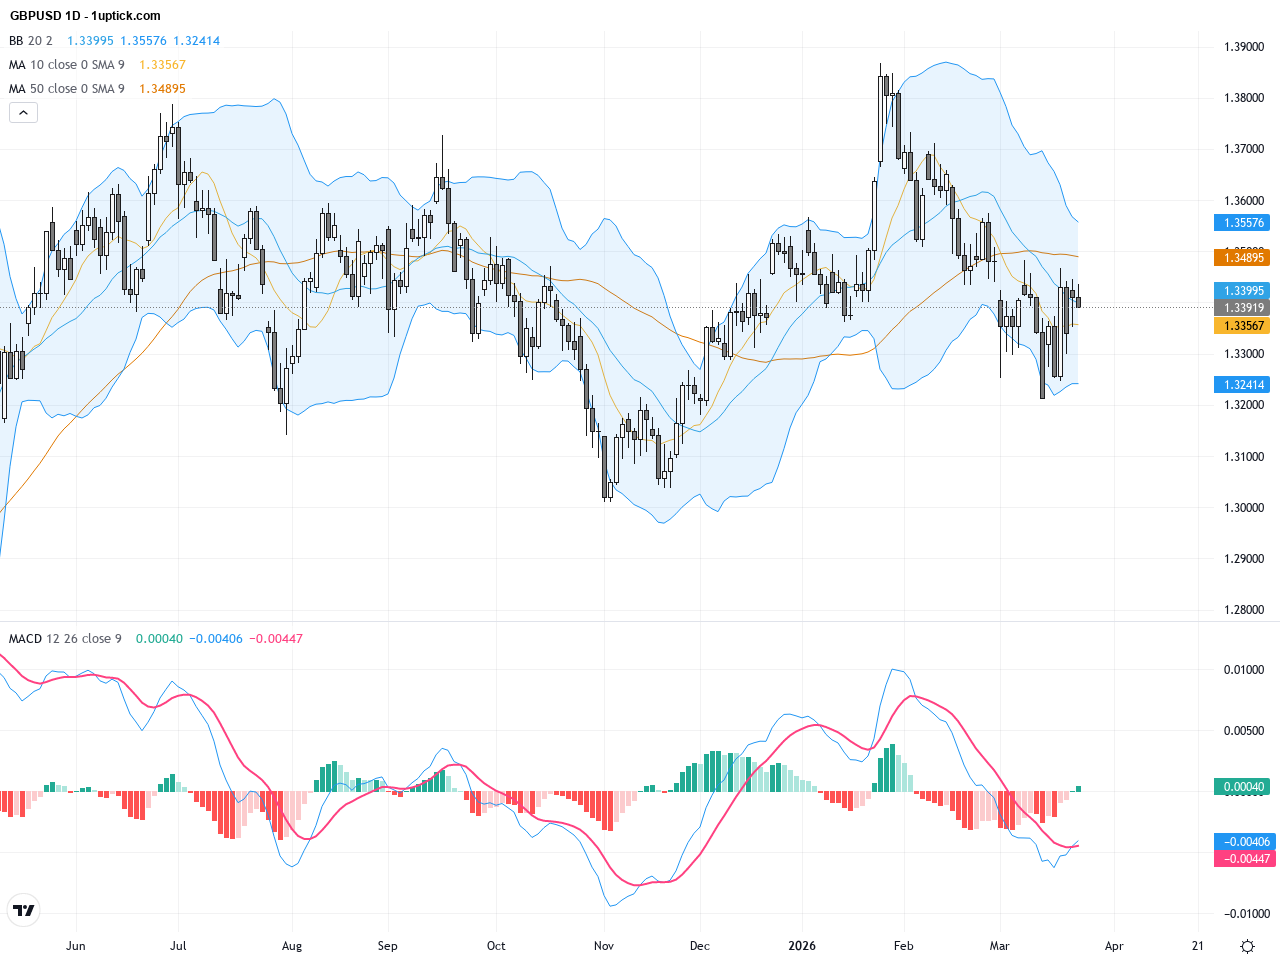
On the daily chart, GBPUSD has displayed a clear oscillating uptrend since early March, with recent prices repeatedly testing the resistance near 1.3437. The 50-day moving average at 1.351 remains a key overhead resistance, while the 200-day moving average near 1.34143 acts as immediate support. Bollinger Bands have narrowed, indicating reduced recent volatility. The MACD hovers around the zero line, reflecting a balanced battle between bulls and bears. This suggests the daily trend is in a consolidation phase with a bullish bias, awaiting a breakout to confirm further gains.
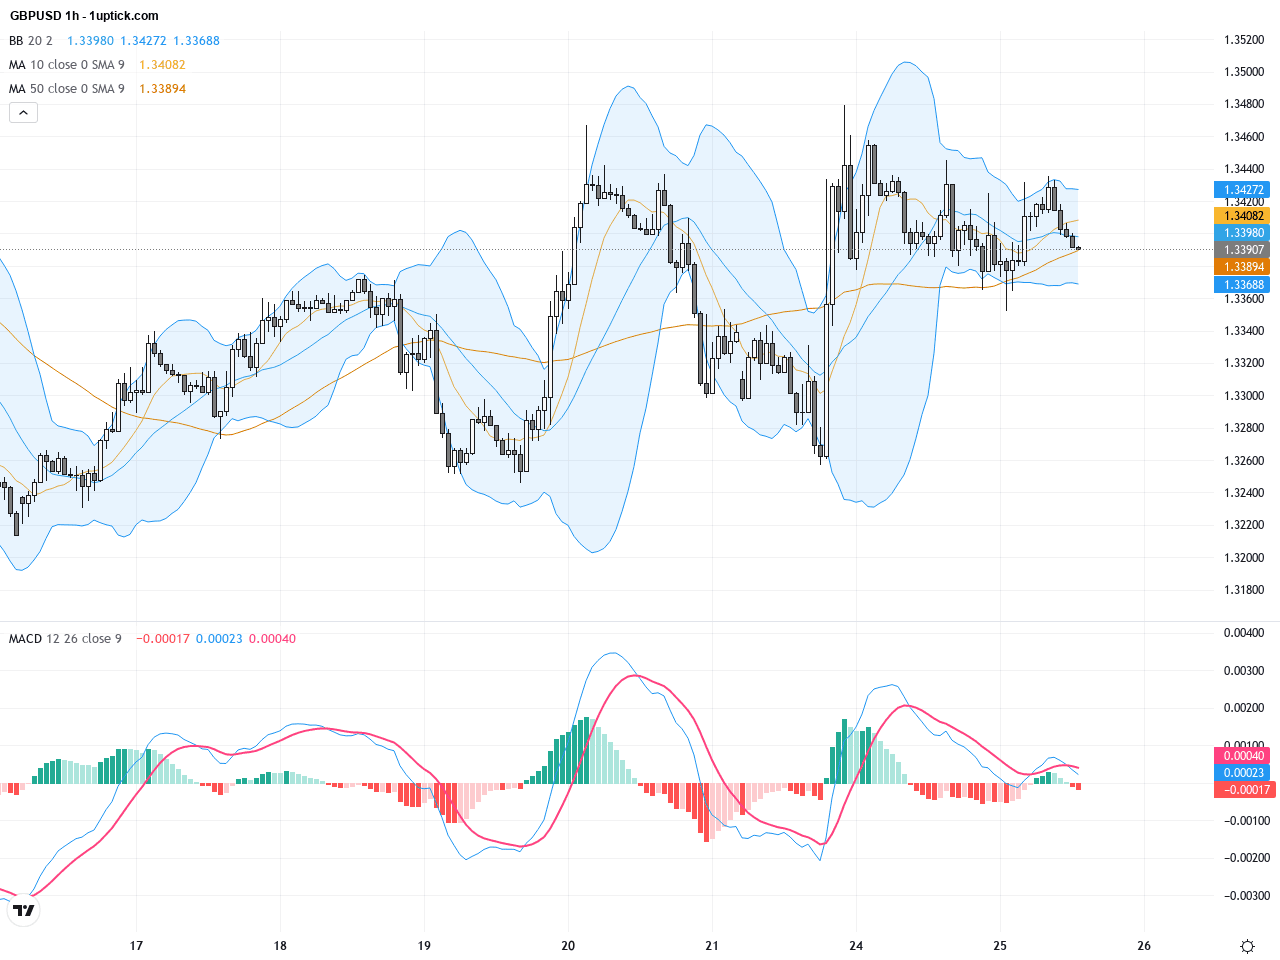
The hourly chart shows price fluctuation between 1.3350 and 1.3437 over the past 3-5 days. Bollinger Bands alternately expand and contract, signaling elevated short-term volatility. The short-term moving averages (10 and 20) have crossed multiple times, with the latest MACD crossover bearish and RSI slipping below 50, indicating short-term weakness. However, the recent bullish engulfing candlestick pattern hints at a potential short-term rebound, though the dominant resistance at 1.3437 remains a key hurdle.
Technical Trend: GBPUSD is currently exhibiting a cautious consolidation with a mildly bullish bias, best described as ‘Cautiously Bullish’.
Technically, GBPUSD is forming a potential ascending triangle pattern on the daily chart, with repeated tests of the 1.3437 resistance since the start of March, suggesting a breakout above this level could trigger further upside momentum. On the hourly chart, the recent bullish engulfing candlestick pattern indicates short-term buying strength, yet a bearish MACD crossover warns of possible near-term correction. Traders should closely watch the upcoming UK CPI release and the pair’s ability to sustain a break above 1.3437 to confirm the bullish continuation.Today’s GMT+1 economic calendar features several key UK data releases at 08:00, including the Consumer Price Index, Core Consumer Price Index, Retail Price Index, and Producer Price Index for February. These releases will critically influence GBPUSD, with better-than-expected CPI data likely to reinforce the Bank of England’s hawkish stance and potentially drive the pound higher. Conversely, weaker data could increase short-term selling pressure. Additionally, Australian CPI data is released but is expected to have a marginal impact on GBPUSD. Overall, these UK inflation figures are the most significant event for the pair today.
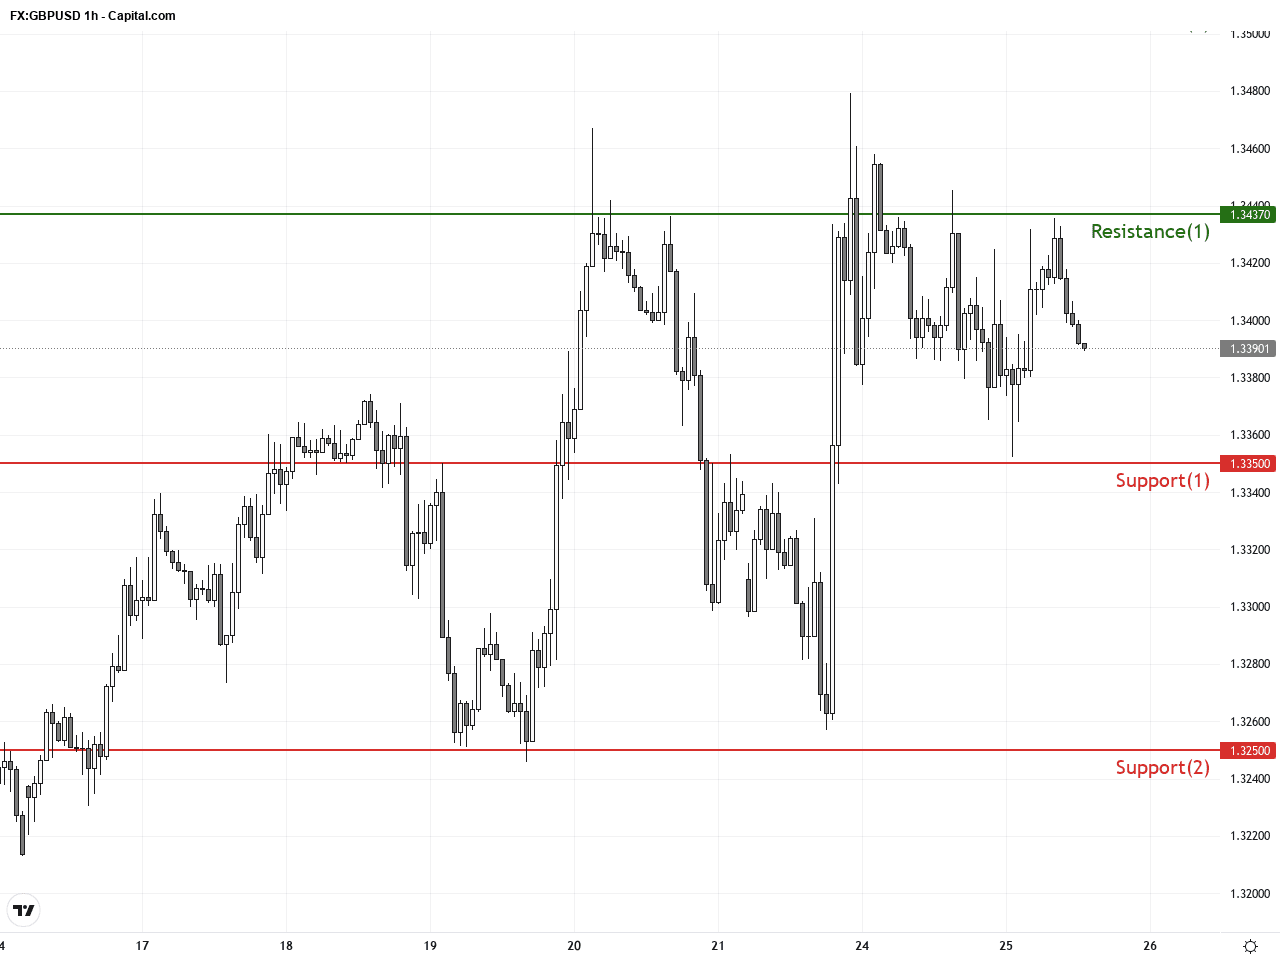
Resistance & Support
The above financial market data, quotes, charts, statistics, exchange rates, news, research, analysis, buy or sell ratings, financial education, and other information are for reference only. Before making any trades based on this information, you should consult independent professional advice to verify pricing data or obtain more detailed market information. 1uptick.com should not be regarded as soliciting any subscriber or visitor to execute any trade. You are solely responsible for all of your own trading decisions.