


 |
| Gold V.1.3.1 signal Telegram Channel (English) |
GBPUSD: Key Trendline Break Signals Potential 470-Pip Decline – Technical & Fundamental Trading Outlook
2026-03-06 @ 13:01
Over the past 24 to 48 hours, the GBP/USD exchange rate has experienced a noticeable decline from yesterday’s closing price near 1.33625. While there was some attempt at recovery earlier in the week, the release of strong US employment data accompanied by rising geopolitical tensions in the Middle East pressured the Pound, driving investors toward the safe-haven US Dollar and pushing the Dollar Index (DXY) up to 99.20.
Recent market news highlights that escalating tensions involving Iran and the broader Middle East have intensified safe-haven demand, boosting the US Dollar. Moreover, stronger-than-expected US nonfarm payroll data dampened hopes for near-term Federal Reserve rate cuts, further supporting the Dollar. These factors have kept GBP/USD oscillating near lower levels over the last two days as the market watches whether the US Dollar can maintain dominance over the Pound.
For the average investor, this sharp dip in GBP/USD resembles funds rushing into a safer shelter amid sudden geopolitical turmoil, with the Dollar becoming the preferred refuge. This has led to capital outflows from the Pound. In the near term, if Middle East tensions persist or US economic data continues to show strength, traders should brace for continued downward pressure on GBP/USD.

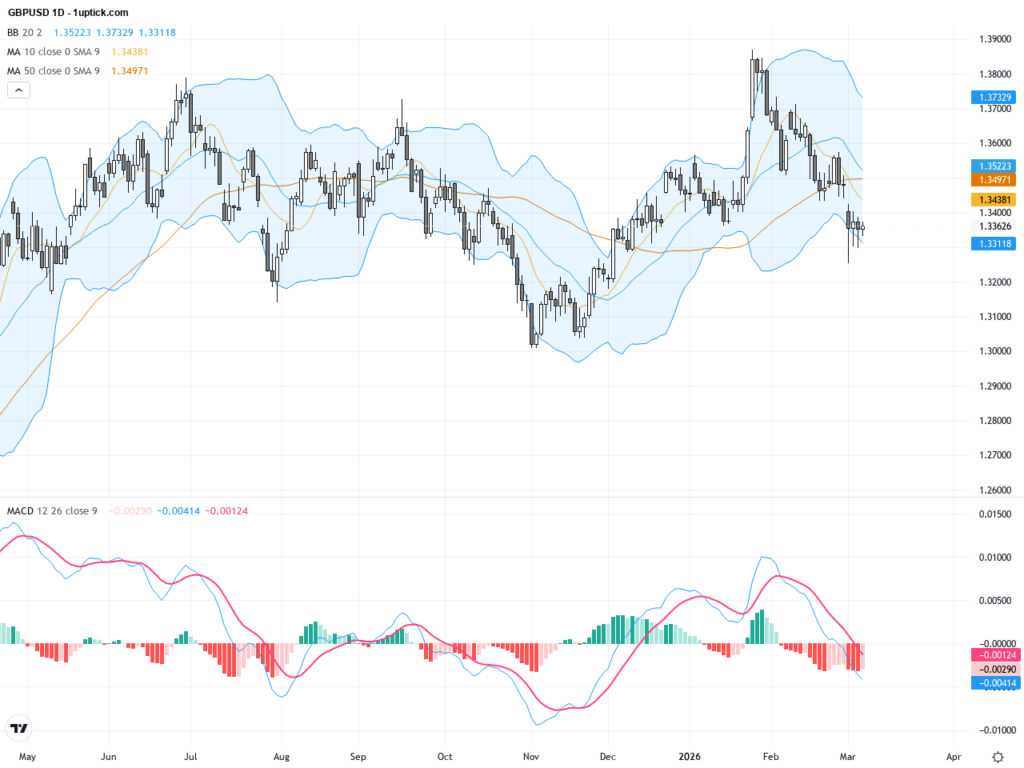
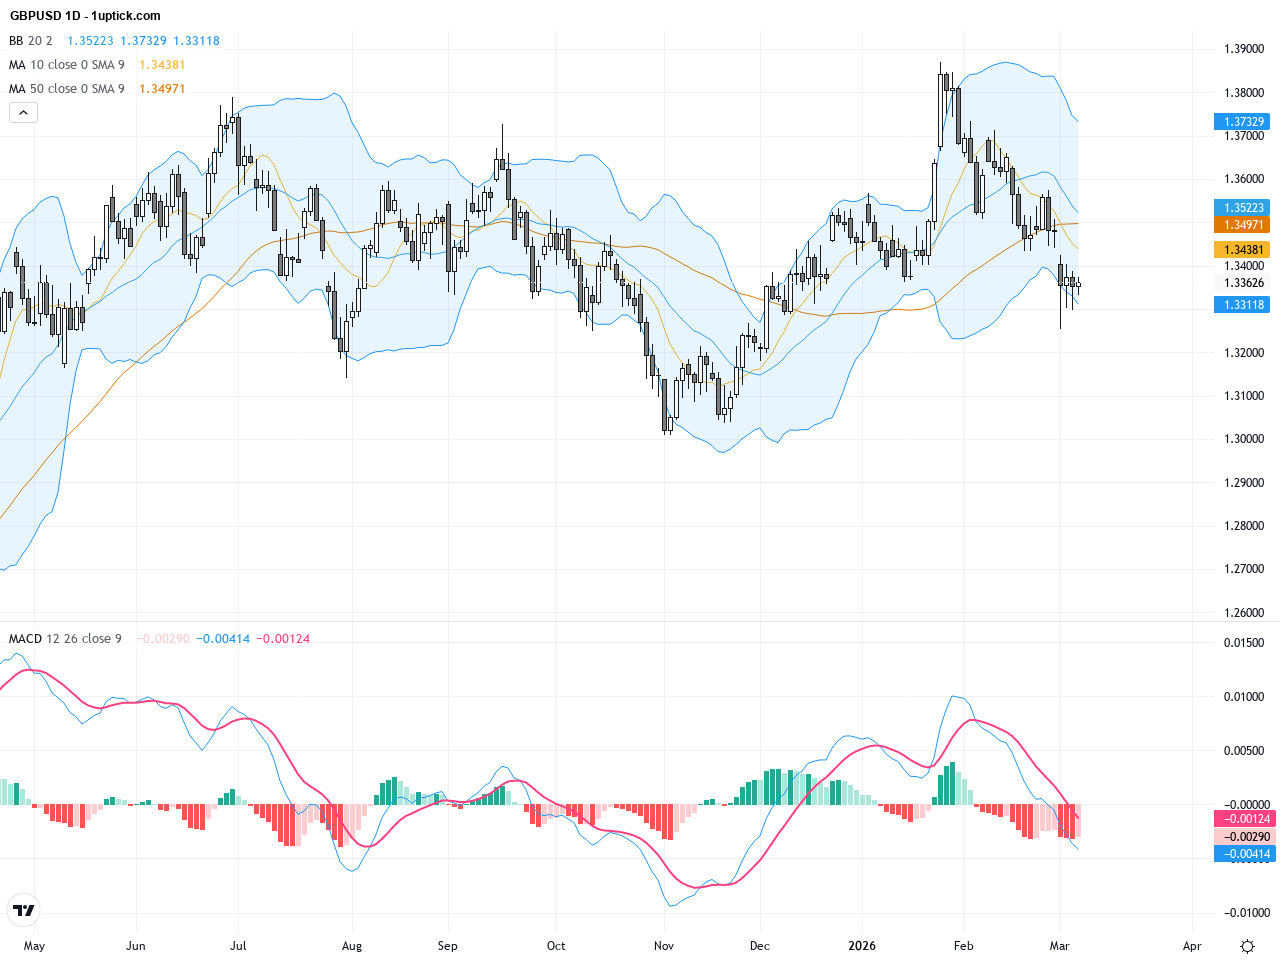
The daily chart shows GBPUSD forming a strong uptrend earlier this year, but it has since reversed sharply from the 1.3866 peak and decisively broken below an important ascending trendline. This move signals waning bullish momentum. The pair currently trades below the 200-day moving average (around 1.34166), with the 50-day and 200-day averages forming a bearish death cross—heightening downside risk. Bollinger Bands indicate increasing volatility as price drifts toward the lower band. The MACD remains bearish and growing stronger, underscoring the weakening long-term trend and a clear risk skew to the downside.
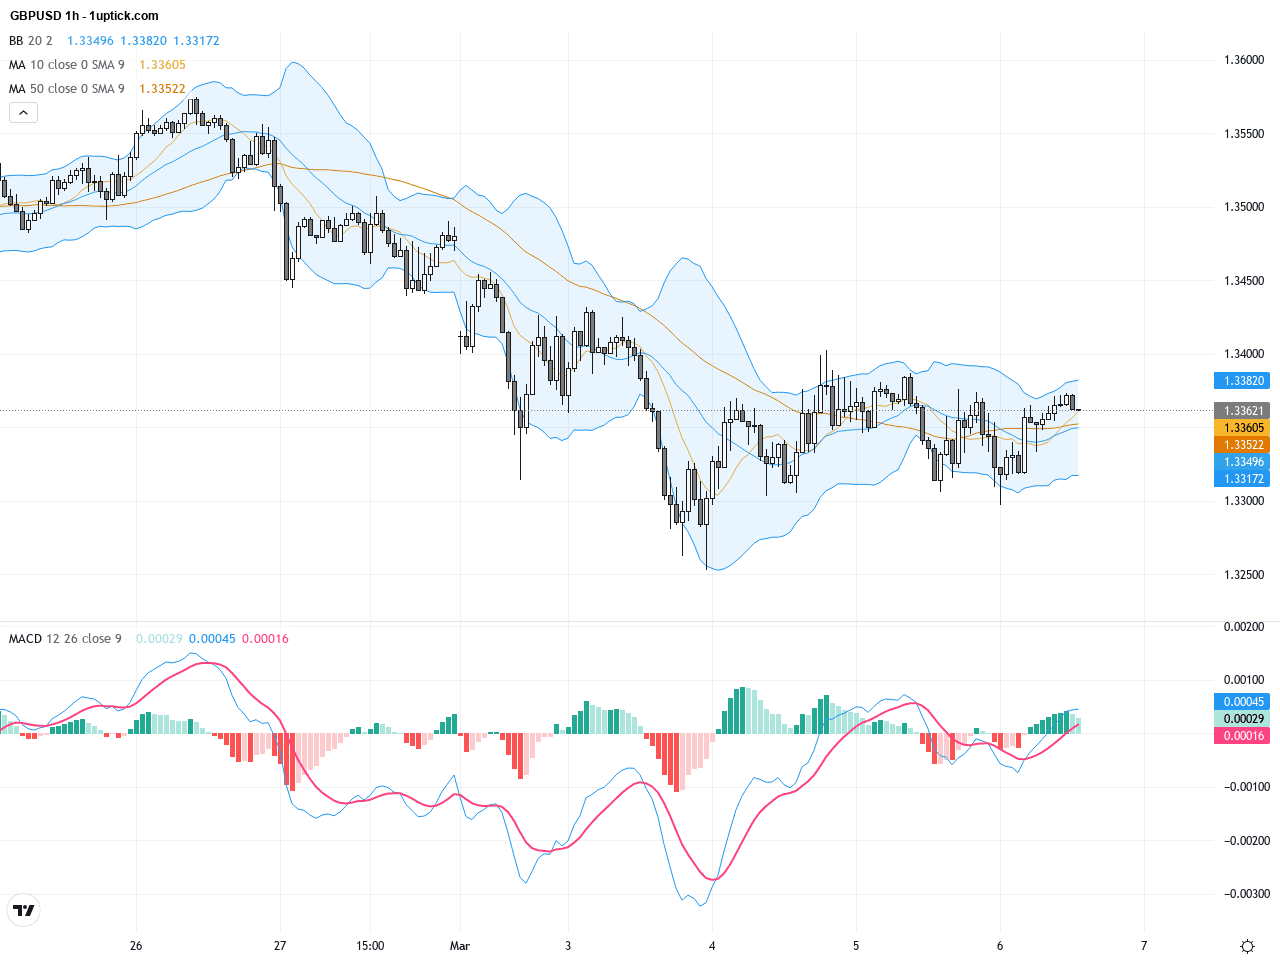
On the hourly chart, GBPUSD shows a clear downtrend and a descending channel over the last 3-5 days. Short-term moving averages (15 and 50 periods) slope downward, pressuring price below resistance levels after failed rebounds. Bollinger Bands are widening, reflecting heightened intraday volatility. The recent MACD death cross and RSI near oversold levels hint at a possible short-lived bounce, but the dominant trend remains negative. The formation of a bearish flag pattern suggests further downside potential if support near 1.3330 breaks.
Technical Trend: The current trend is cautiously bearish, with GBPUSD entering a higher volatility consolidation phase that seems tilted to the downside over the short term.
Technically, GBPUSD’s break below its key ascending trendline, coupled with a bearish death cross on the daily moving averages and strong MACD downtrend, indicates increased downside risk. The bearish flag on the hourly chart suggests momentum may accelerate lower if 1.3330 support gives way, potentially targeting the 1.29–1.30 zone. Recent candlestick patterns confirm persistent selling pressure with minimal bullish reversals. Traders should remain cautious, especially ahead of US data, and focus on risk management amid continued volatility.Today’s GMT+1 economic calendar features limited direct impact events for GBPUSD. UK Halifax House Prices data at 08:00 (forecast 0.3%) is unlikely to move the pair significantly. Market attention remains firmly on the US Non-Farm Payrolls release and related employment data at 14:30, with expectations of modest job gains (60K) and steady unemployment (4.3%). Several Fed officials’ speeches throughout the day could add to volatility and sentiment shifts. Hence, near-term price action will largely hinge on US economic outcomes and Federal Reserve communication.
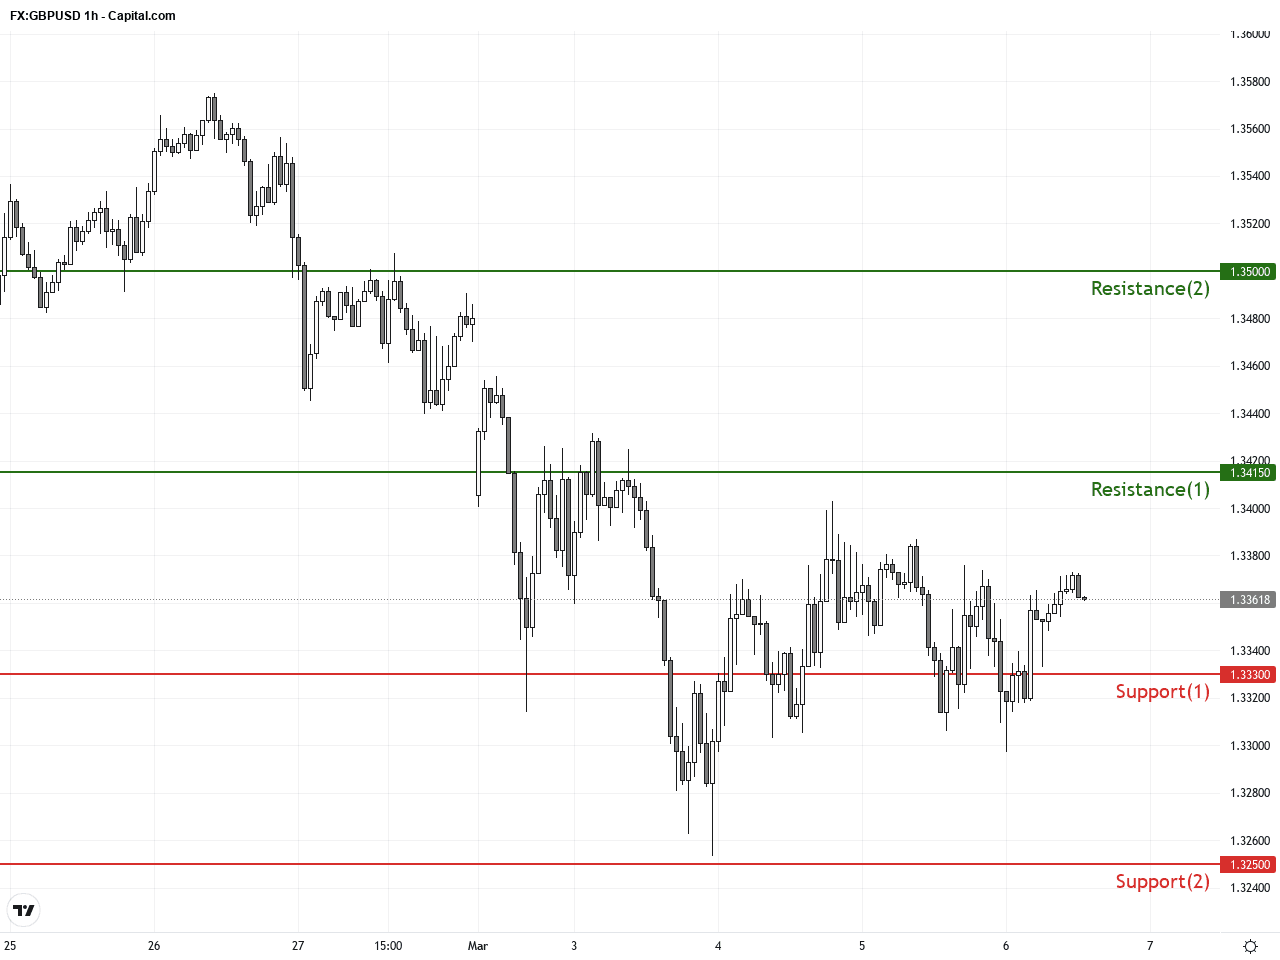
Resistance & Support
The above financial market data, quotes, charts, statistics, exchange rates, news, research, analysis, buy or sell ratings, financial education, and other information are for reference only. Before making any trades based on this information, you should consult independent professional advice to verify pricing data or obtain more detailed market information. 1uptick.com should not be regarded as soliciting any subscriber or visitor to execute any trade. You are solely responsible for all of your own trading decisions.