


 |
| Gold V.1.3.1 signal Telegram Channel (English) |
USDCAD: Oil Surge Pressures USD as Technical Patterns Signal Bearish Momentum
2026-03-10 @ 13:01
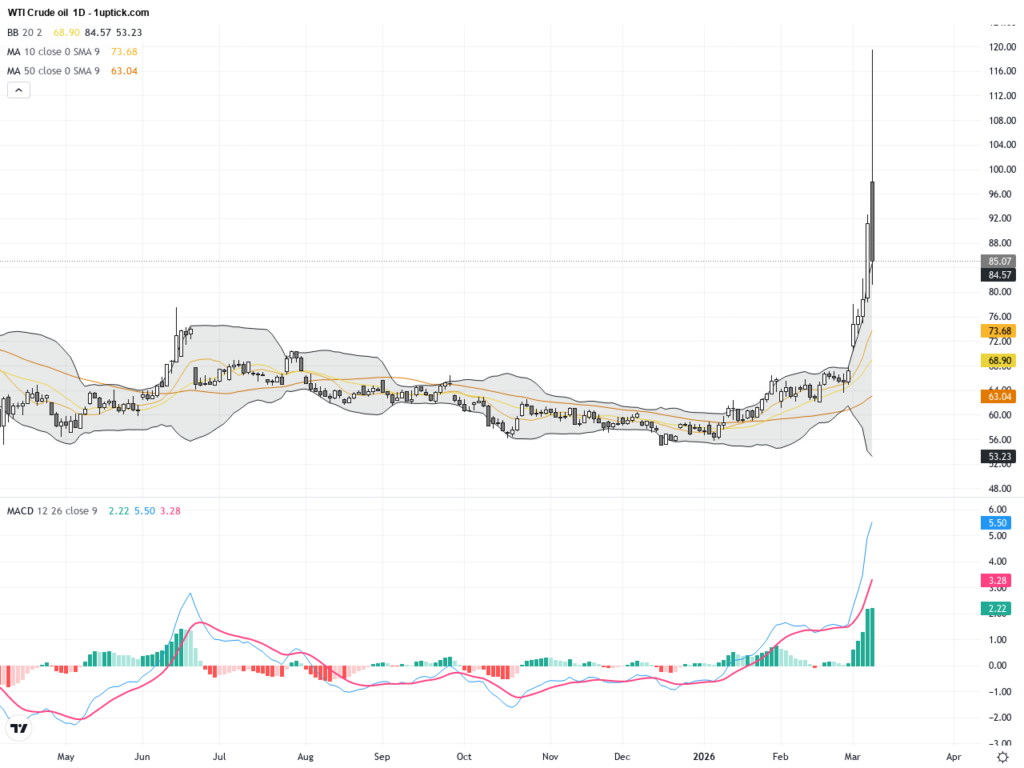
Over the past 24 to 48 hours, the USD/CAD currency pair exhibited noticeable volatility. After fluctuating slightly around yesterday’s closing price of 1.35894, market attention was firmly drawn to oil prices breaking above $100 per barrel. Tightening oil supply both in the U.S. and globally pushed prices higher, boosting demand for the Canadian dollar, which typically correlates positively with oil price movements due to Canada’s major role as an oil exporter. As a result, the USD/CAD rate edged lower from yesterday, reflecting stronger demand for the Canadian dollar.
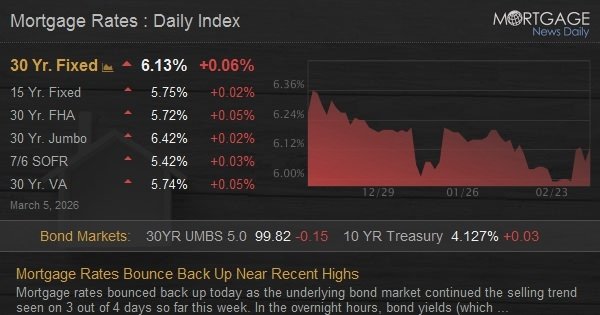
Recent market news shows the U.S. Dollar Index attempted to slip back below the 98.90 to 99.05 support zone. However, with robust oil prices climbing, the dollar overall faced some pressure. Investors grappled with risk appetite fluctuations, echoed by the USD/CAD price behavior. Notably, weak U.S. nonfarm payroll data released recently raised concerns about slowing U.S. economic growth, further supporting a stronger Canadian dollar.
For the average investor, the recent market developments can be seen as oil price movements directly affecting the relative value between the U.S. dollar and the Canadian dollar. Rising oil prices mean increased Canadian export revenues, making the Canadian dollar more attractive. Meanwhile, disappointing U.S. economic indicators have weighed on the dollar. Hence, the downward pressure on USD/CAD aligns with supply and demand logic, reminding investors to closely watch energy market news—such dynamics will continue to influence short-term currency fluctuations.
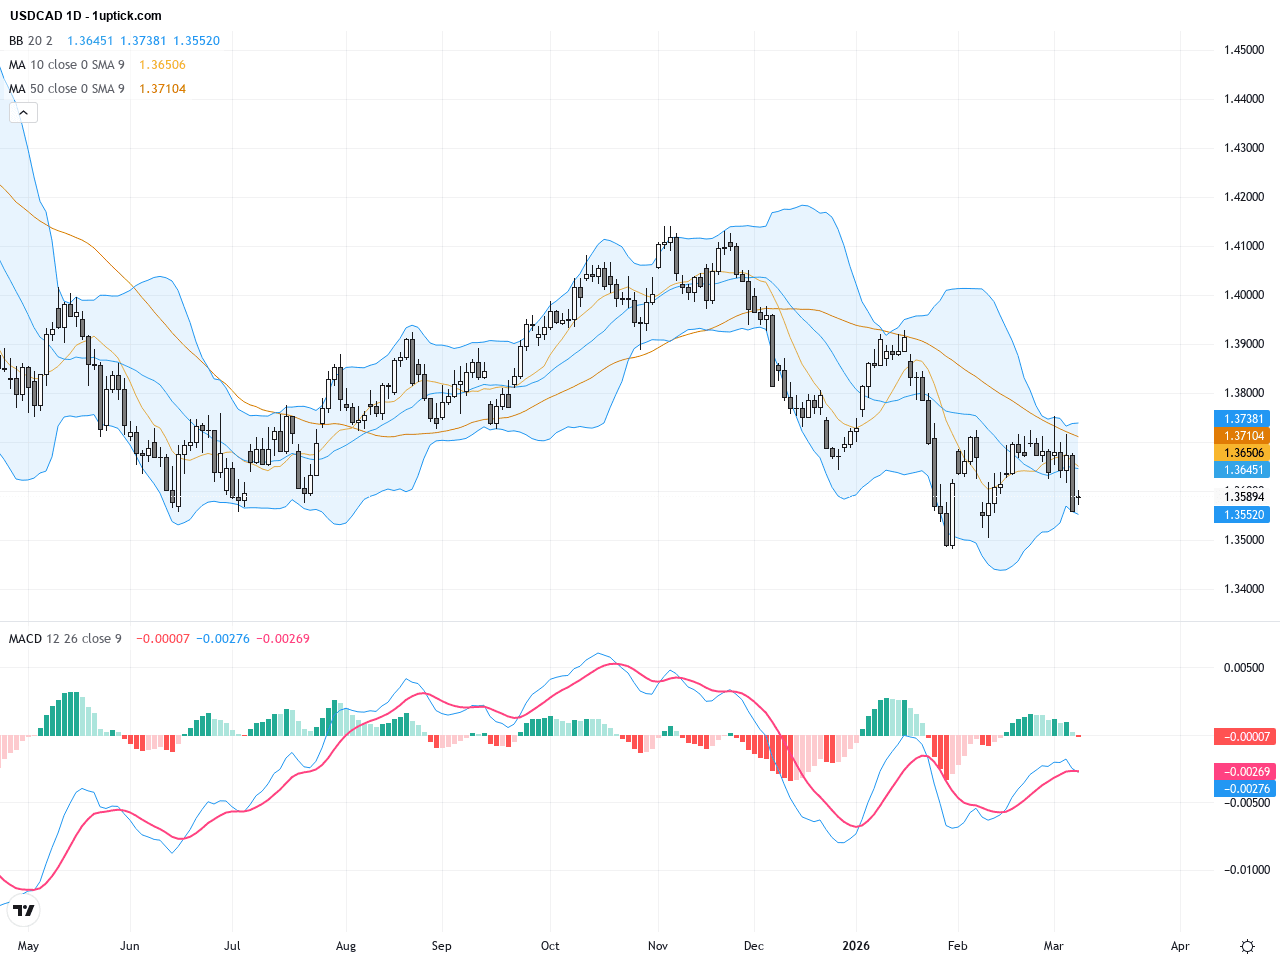
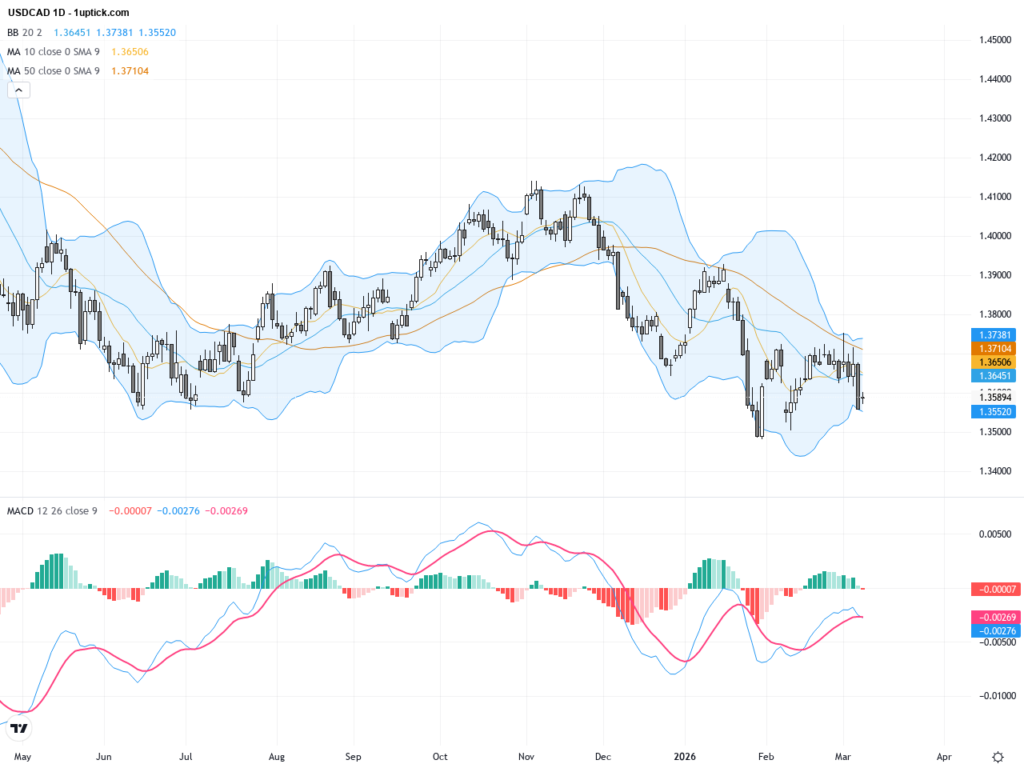
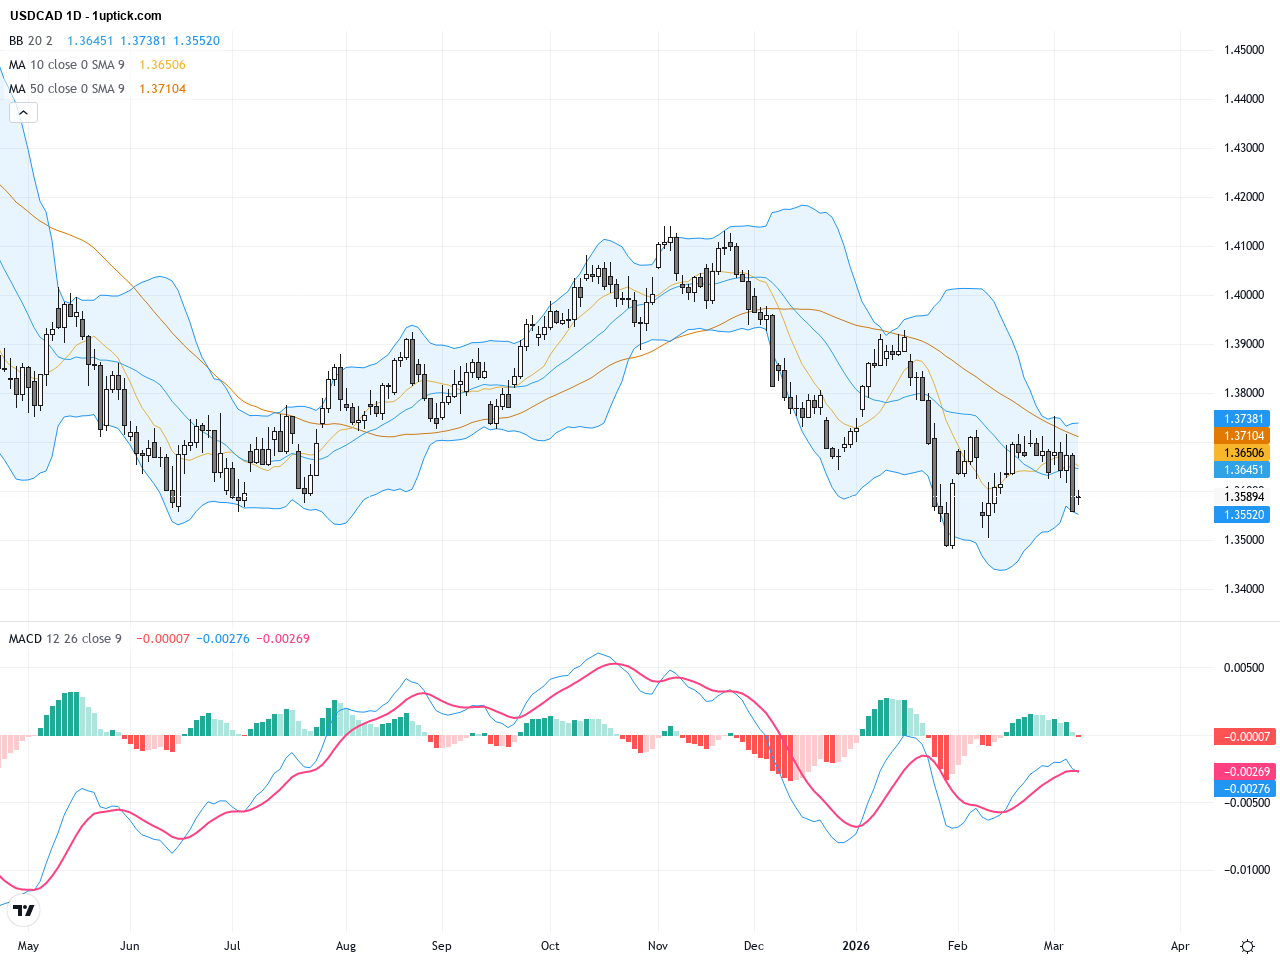
The daily chart for USDCAD shows a clear downtrend from the recent peak around 1.3700, with prices trading below the 50-day moving average (approximately 1.36886) and near the 200-day moving average (about 1.38269). The Bollinger Bands are tightening, signaling reduced volatility but a downward bias as the lower band has been tested frequently. The MACD indicator has crossed below the zero line, hinting at bearish momentum in the medium term. Overall, the daily technical setup confirms ongoing bearish pressure with potential testing of lower support levels on the horizon.
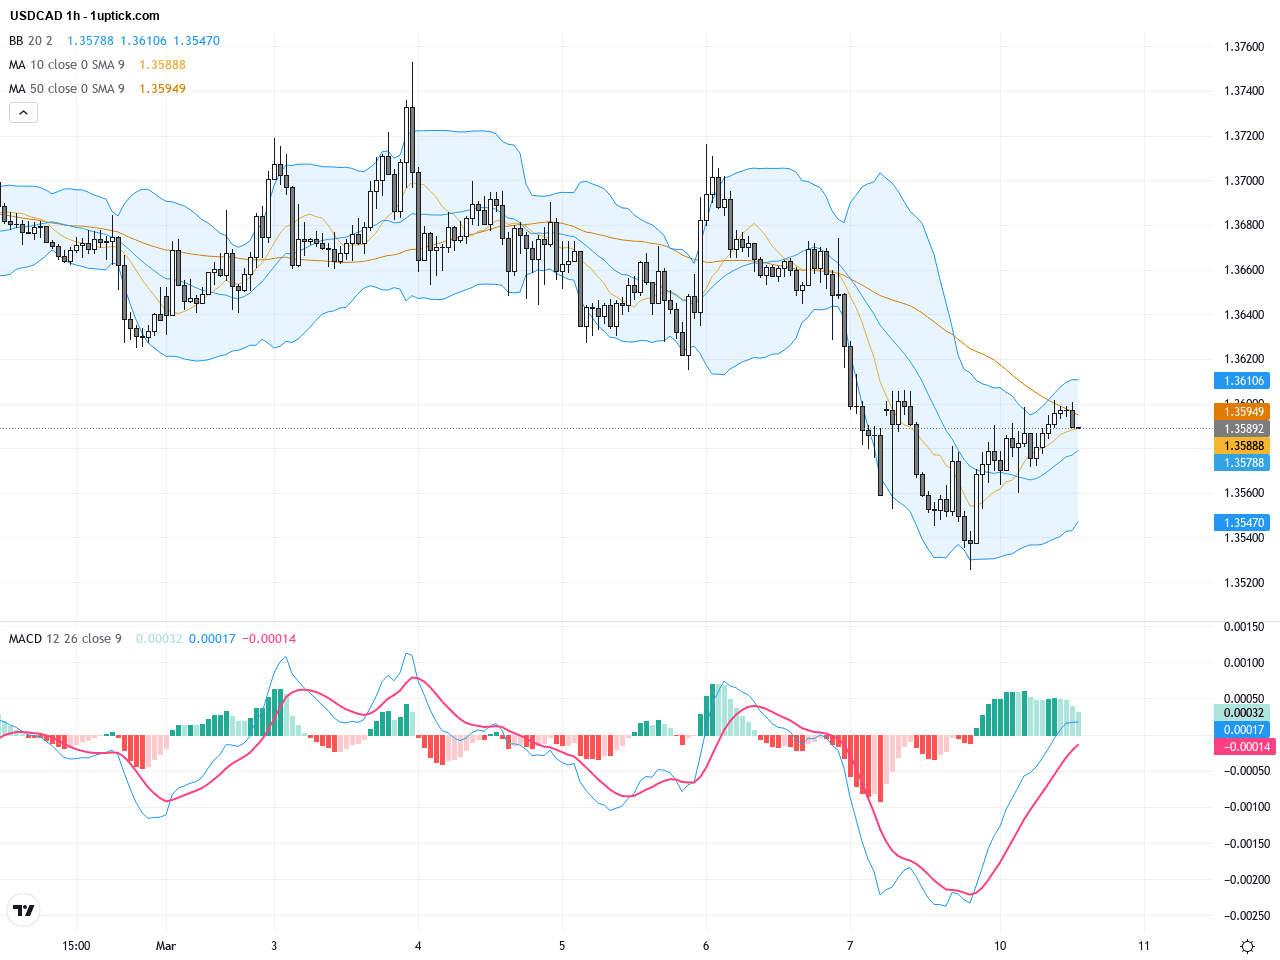
On the hourly chart, USDCAD has been consolidating within a tight range between 1.3550 and 1.3660 over the past 3-5 days. Price action shows multiple tests of the 1.3565 support without a decisive break. Bollinger Bands reveal slight expansion, indicating potential for a breakout soon. The MACD line has recently crossed below its signal line, accompanied by diminishing momentum bars. A bearish engulfing candlestick pattern has formed recently, pointing to possible further decline over the next 24 hours if the 1.3550 support breaks decisively.
Technical Trend: Cautiously Bearish
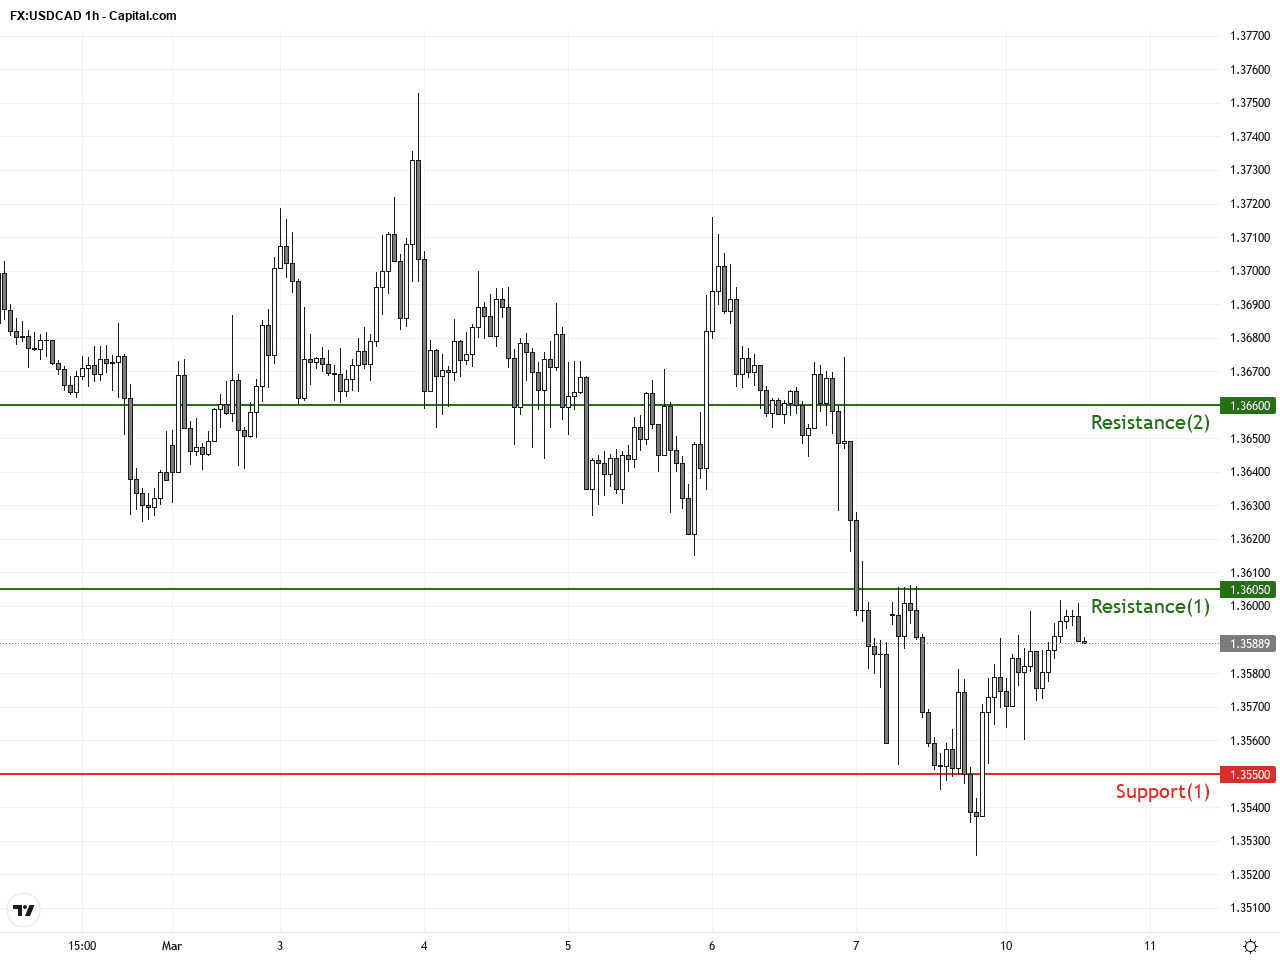
Technical signals suggest USDCAD is testing a key support zone with multiple indicators favoring bearish momentum. Rising oil prices provide underlying support for the Canadian dollar while the U.S. dollar faces pressure amid weak economic data. Pay close attention to the MACD bearish crossover and the Bollinger Bands lower trend for signs of an imminent breakout. A decisive break below 1.3550 could open the path down to the 1.3480 support area.There are no significant or directly relevant economic events scheduled today that would impact USDCAD. While Japanese GDP and Chinese trade data show strong figures, their influence on USD/CAD is limited. Traders should nevertheless keep an eye on upcoming U.S. Existing Home Sales data later today, as this could indirectly affect U.S. dollar sentiment and thus USDCAD pricing.
Resistance & Support
The above financial market data, quotes, charts, statistics, exchange rates, news, research, analysis, buy or sell ratings, financial education, and other information are for reference only. Before making any trades based on this information, you should consult independent professional advice to verify pricing data or obtain more detailed market information. 1uptick.com should not be regarded as soliciting any subscriber or visitor to execute any trade. You are solely responsible for all of your own trading decisions.