


 |
| Gold V.1.3.1 signal Telegram Channel (English) |

USDCAD: Technical Weakness Emerges as Oil Price Surge Supports CAD
2026-03-03 @ 13:01
Over the past 24 to 48 hours, the USD/CAD pair showed slight fluctuations, closing at 1.36721, marginally lower than the previous day. The escalating US-Iran tensions fueled a risk-off mood, boosting demand for the safe-haven US dollar, yet soaring oil prices provided significant support to the Canadian dollar, offsetting some of the dollar’s strength.
During this period, oil prices surged sharply due to instability in the Middle East, benefiting the CAD as a commodity currency. Market observers note that although global risk aversion boosted the USD, strong oil fundamentals kept the Canadian dollar steady, preventing major swings in USD/CAD.
For the average investor, this timeframe signals that forex volatility was mainly driven by geopolitical events. Meanwhile, strong Canadian oil exports acted as a buffer for the CAD. If you hold USD/CAD positions, it is crucial to keep an eye on oil price trends and ongoing Middle East developments, as these factors will continue to influence the pair’s direction.
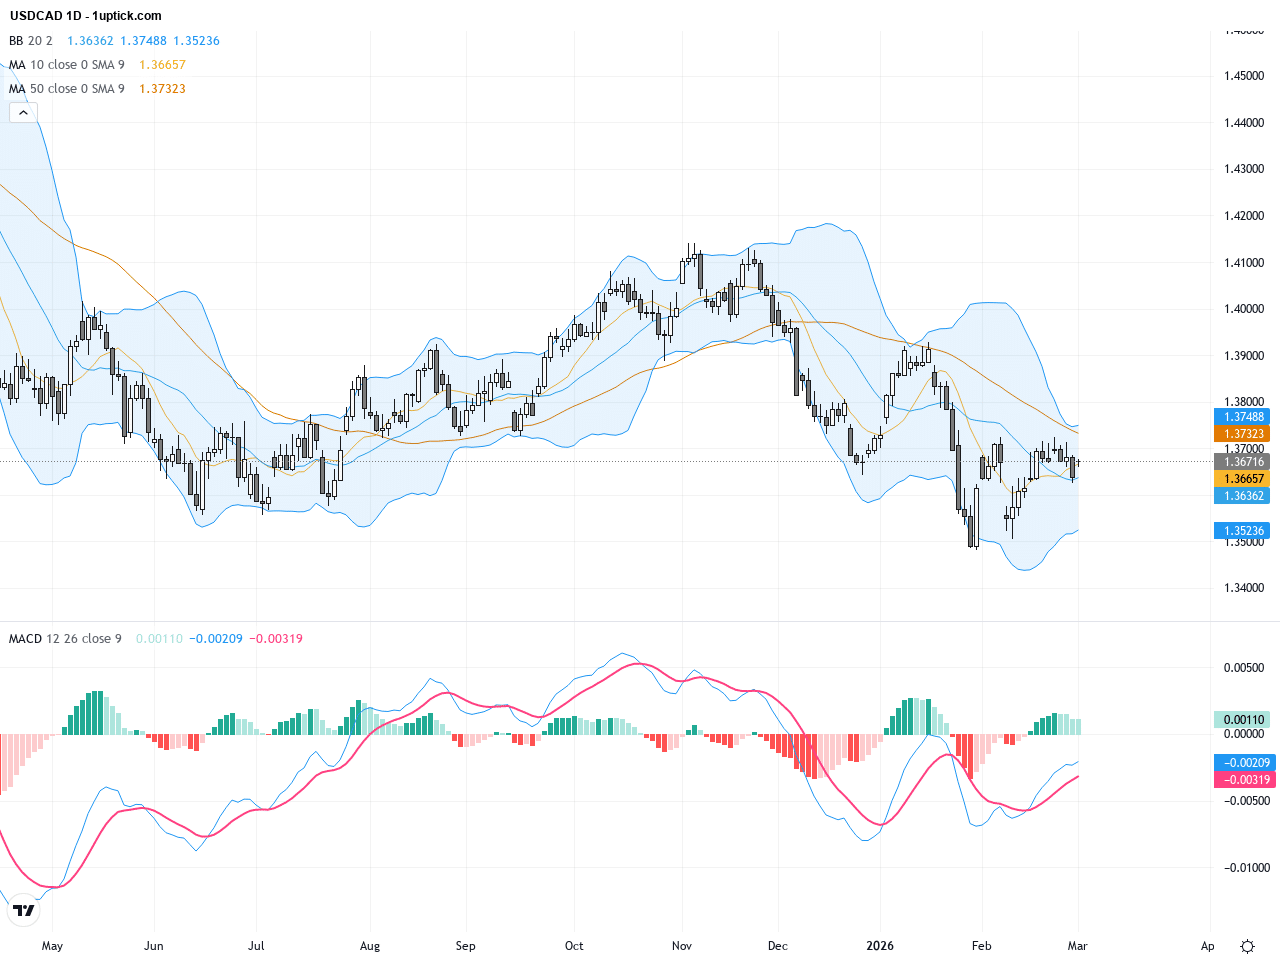
The daily chart for USDCAD depicts a downtrend starting from late February, with the price retreating from near 1.375 and repeatedly testing support below 1.365. The 50-day moving average at 1.37152 and 200-day moving average at 1.383 remain above current price levels, confirming medium- to long-term resistance. Bollinger Bands are narrowing, indicating reduced volatility but potential breakout soon. The MACD hovers around the zero line, signaling no definitive momentum presently and highlighting a need for vigilant close observation.
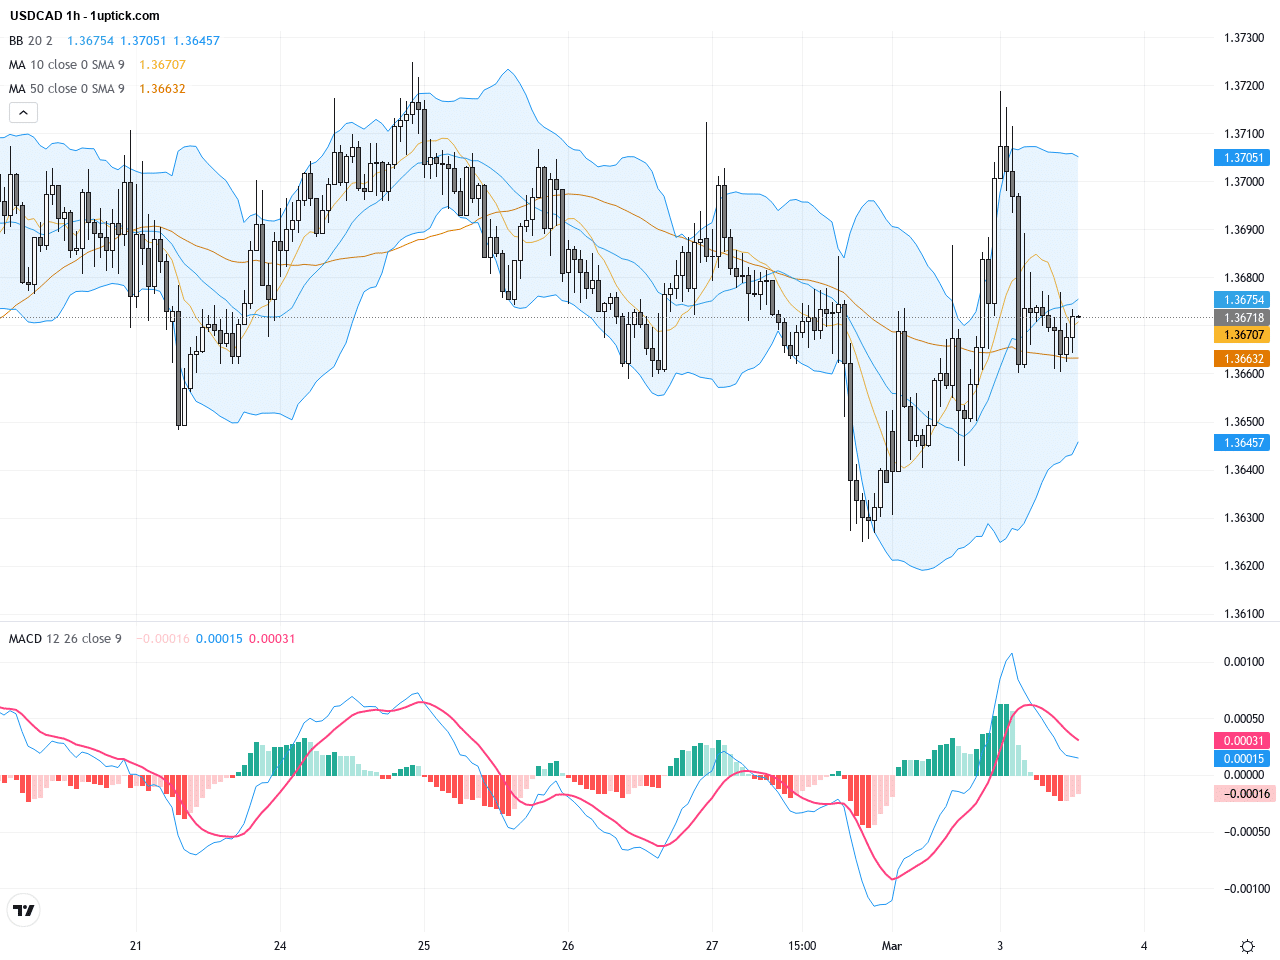
The hourly chart over the last five days reveals a weak corrective and consolidative structure. Price oscillates between 1.3650 and 1.3710 after a pullback from just below 1.3700. The 20 EMA acts as immediate resistance, while the MACD shows a bearish divergence hinting waning short-term bullish momentum. The expanding Bollinger Bands suggest an imminent breakout from the current range. The critical resistance level to watch is 1.3728; surpassing this could reinvigorate bulls for a fresh rally.
Technical Trend: The current trend is cautiously bearish with sideways fluctuations, as rising oil prices support CAD while USD gains on safe-haven demand.
From a technical perspective, USDCAD appears to be forming a potential head and shoulders reversal pattern initiated in mid-February. If the right shoulder fails to break the neckline around 1.3728, further downside is likely. The daily chart shows predominant weakness with multiple bearish candlestick patterns like dark cloud cover and engulfing bars, signaling expanding selling pressure. The MACD has crossed to the downside reinforcing bearish momentum. Short-term traders should be cautious of breaks below key support levels while longer-term participants need to watch oil price trends and geopolitical developments carefully.There are no significant economic events directly impacting USDCAD scheduled for today, as neither Canadian nor US major data releases are planned. However, traders should keep an eye on tonight’s US API crude oil inventory report, which holds the potential to strongly influence oil prices and subsequently impact the Canadian dollar and USDCAD pair. Adjustments in trade positions should consider oil market reactions and global risk sentiment shifts.
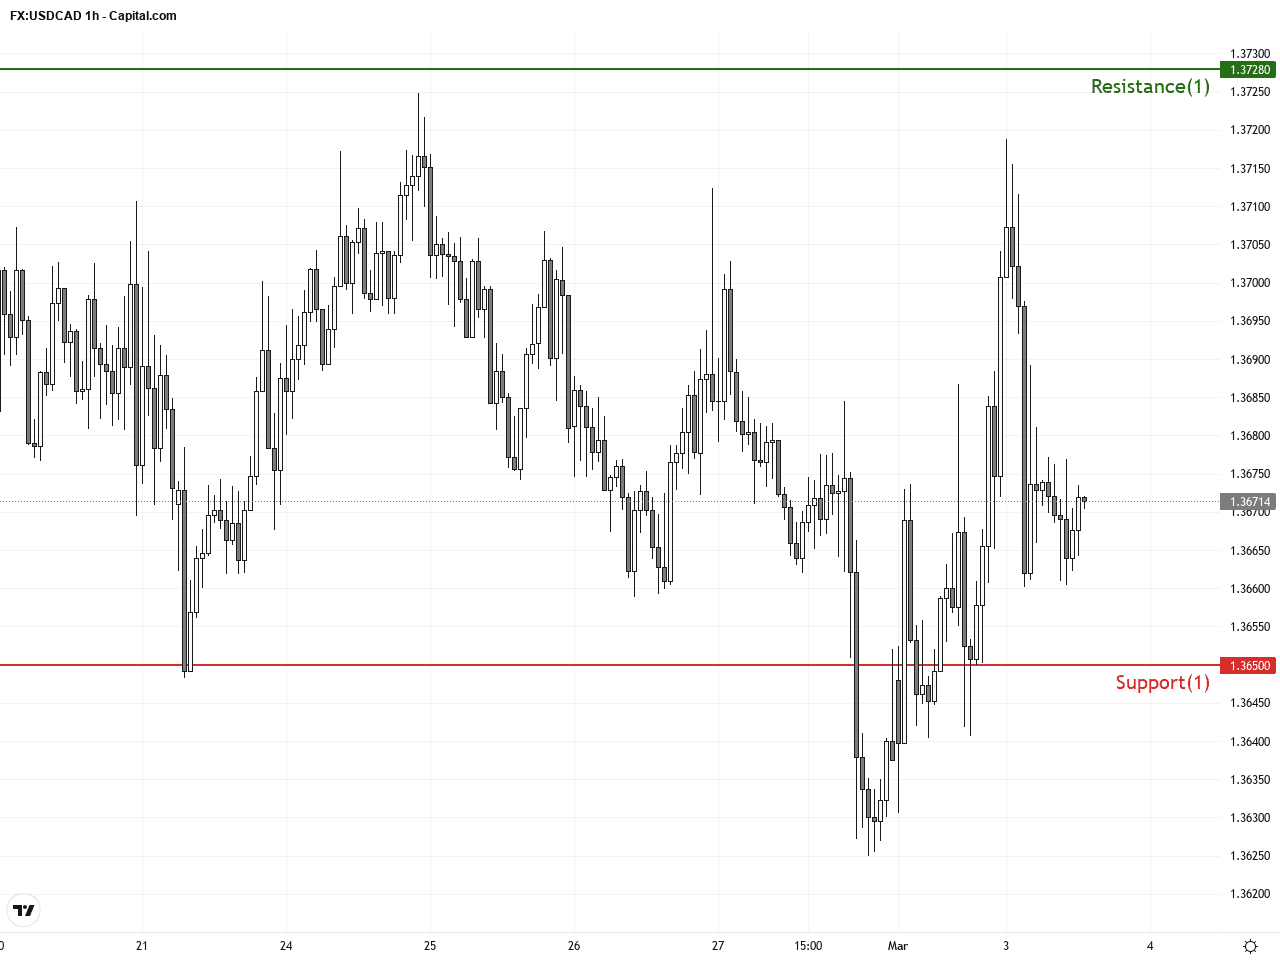
Resistance & Support
The above financial market data, quotes, charts, statistics, exchange rates, news, research, analysis, buy or sell ratings, financial education, and other information are for reference only. Before making any trades based on this information, you should consult independent professional advice to verify pricing data or obtain more detailed market information. 1uptick.com should not be regarded as soliciting any subscriber or visitor to execute any trade. You are solely responsible for all of your own trading decisions.