 |
| Gold V.1.3.1 signal Telegram Channel (English) |
USDJPY: Key Technical Patterns Trigger Trading Signals Amid Strong Support and Resistance
2026-03-02 @ 11:02
Over the past 24 to 48 hours, the USD/JPY pair displayed notable volatility, fluctuating around yesterday’s closing price near 156.27. The market reacted sharply to Tokyo’s latest February CPI data, which showed a slower-than-expected core inflation rate, driving the yen stronger temporarily and pushing USD/JPY down to a low near 155.94. However, the dollar later rebounded supported by strong US labor market data, lifting the pair to a daily high around 156.80.
At the same time, heightened geopolitical tensions influenced the market. Former President Trump’s aggressive remarks on Iran and the related US-Israel actions contributed to increased risk concerns among investors around Middle Eastern uncertainties. Coupled with some dovish comments from Bank of Japan Governor Ueda, this boosted safe-haven demand for the yen for a brief period.
For the average investor, the recent USD/JPY swings highlight the interplay between various global factors — inflation trends and central bank policies on one side, geopolitical shocks on the other. Such dynamics create an environment of fluctuating exchange rates, urging traders to closely monitor macroeconomic and political developments and adapt their strategies prudently to navigate market shifts.
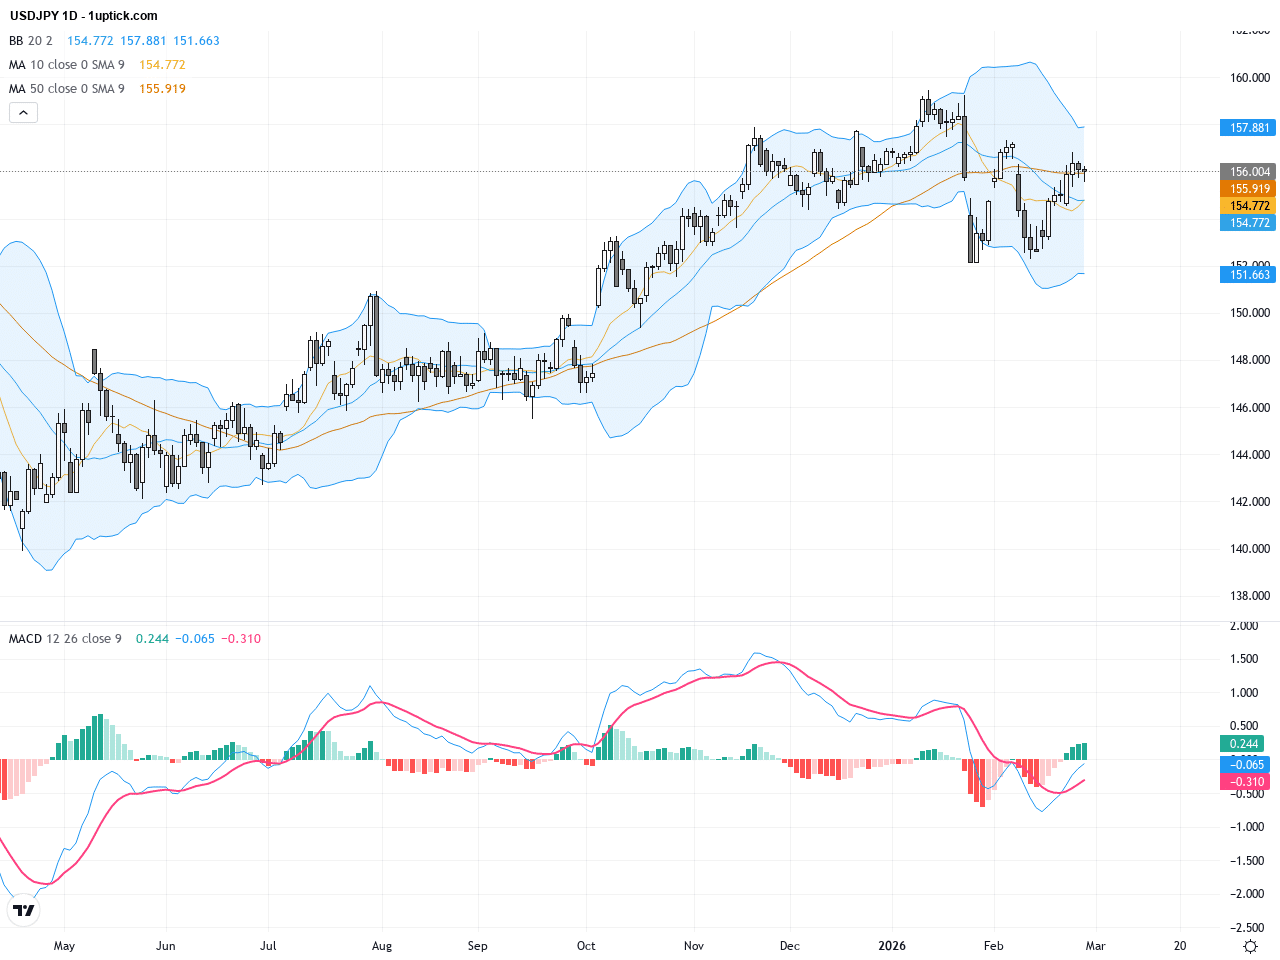
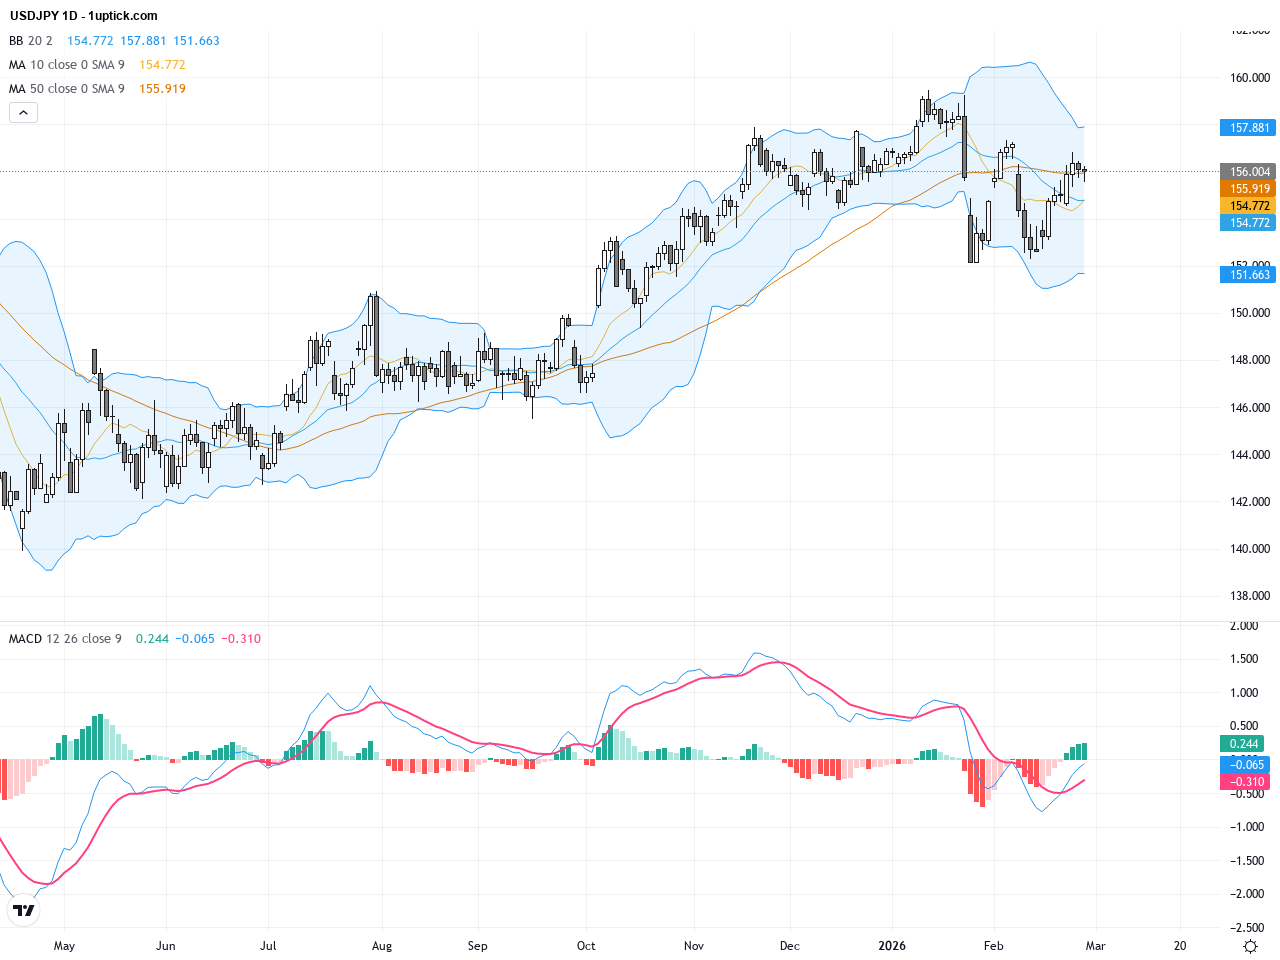
The daily chart shows a steady upward trend for USDJPY, with prices consistently above the 50-day and 200-day moving averages, indicating a bullish medium to long-term outlook. The Bollinger Bands are widening, signaling increased volatility. The MACD remains in positive territory, reflecting strong bullish momentum. Overall, the daily chart demonstrates market preference for the US dollar and sustained buying confidence.
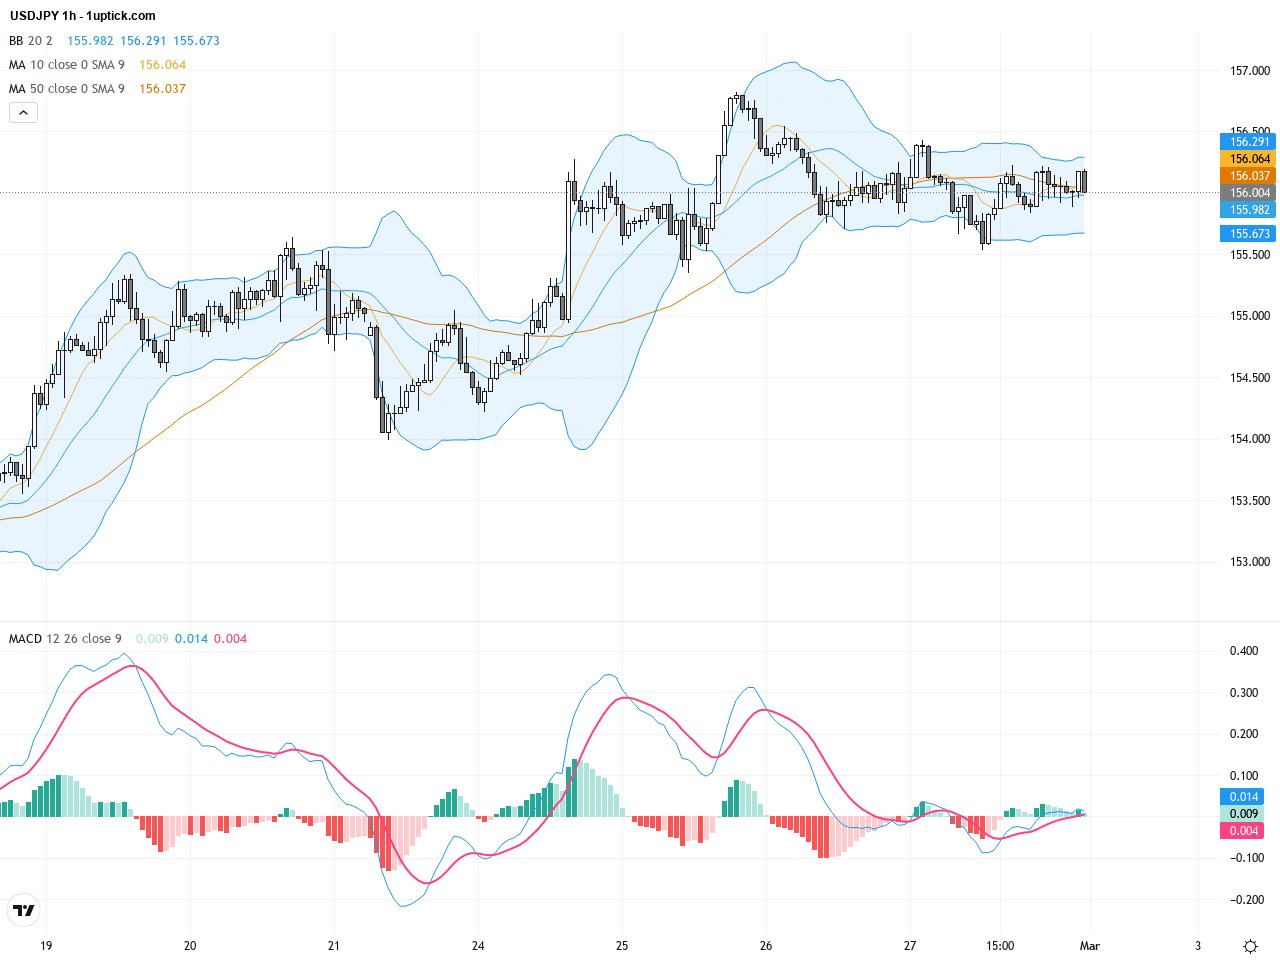
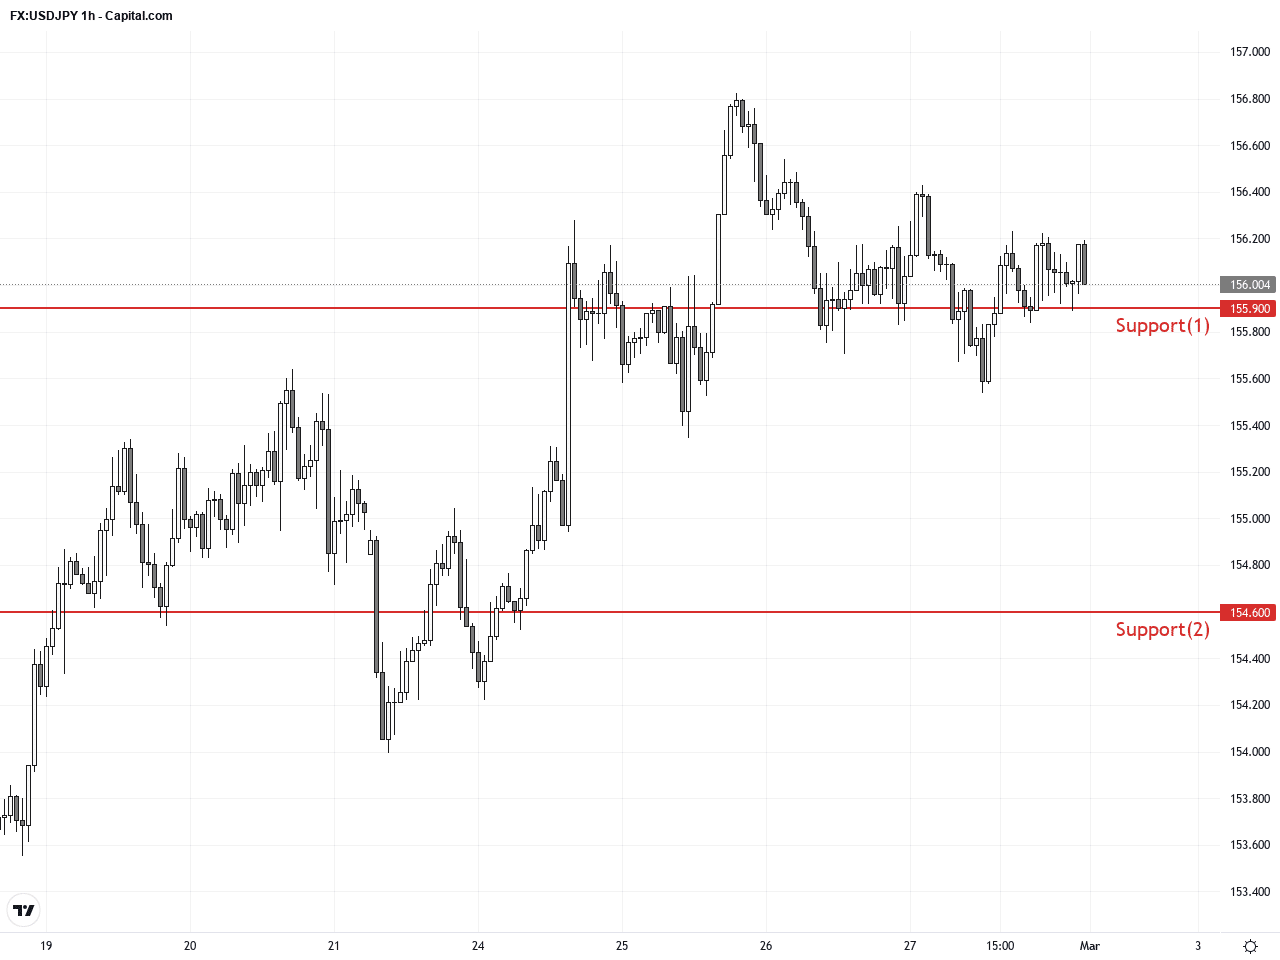
On the hourly chart, USDJPY has seen a breakout above short-term resistance followed by a retracement, forming a consolidation zone over the past 3 to 5 days. The 50-hour moving average and the middle Bollinger Band continue to provide support, suggesting sturdy short-term buying pressure. The latest bearish engulfing candle warns of possible short-term correction, although the overall trend remains bullish. Traders should watch for key level breakouts.
Technical Trend: USDJPY is currently in a cautiously bullish trend, with positive market sentiment but mindful of short-term volatility driven by geopolitical risks.
Technically, USDJPY is in a bullish trend but faces resistance around 157.50. Watch for the MACD crossover signals today — a bullish crossover (golden cross) could confirm further upside momentum. The recent bearish engulfing candle indicates a possible short-term pullback, suggesting buyers seize opportunities at support levels.Today’s economic calendar highlights Japan’s February Manufacturing PMI at 53, exceeding the forecast of 52.8, signaling continued expansion and offering support to the yen. Later, the US will release its ISM Manufacturing Index, expected at 51.7; a lower-than-previous reading could weaken the dollar and pressure USDJPY. No major direct events are scheduled to impact USDJPY significantly today, with attention focused more on geopolitical factors and technical movements.
Resistance & Support
The above financial market data, quotes, charts, statistics, exchange rates, news, research, analysis, buy or sell ratings, financial education, and other information are for reference only. Before making any trades based on this information, you should consult independent professional advice to verify pricing data or obtain more detailed market information. 1uptick.com should not be regarded as soliciting any subscriber or visitor to execute any trade. You are solely responsible for all of your own trading decisions.