


 |
| Gold V.1.3.1 signal Telegram Channel (English) |

USDJPY: Key Triangle Pattern Signals Imminent Breakout Amid Mixed Dollar and Yen Factors
2026-03-18 @ 11:02
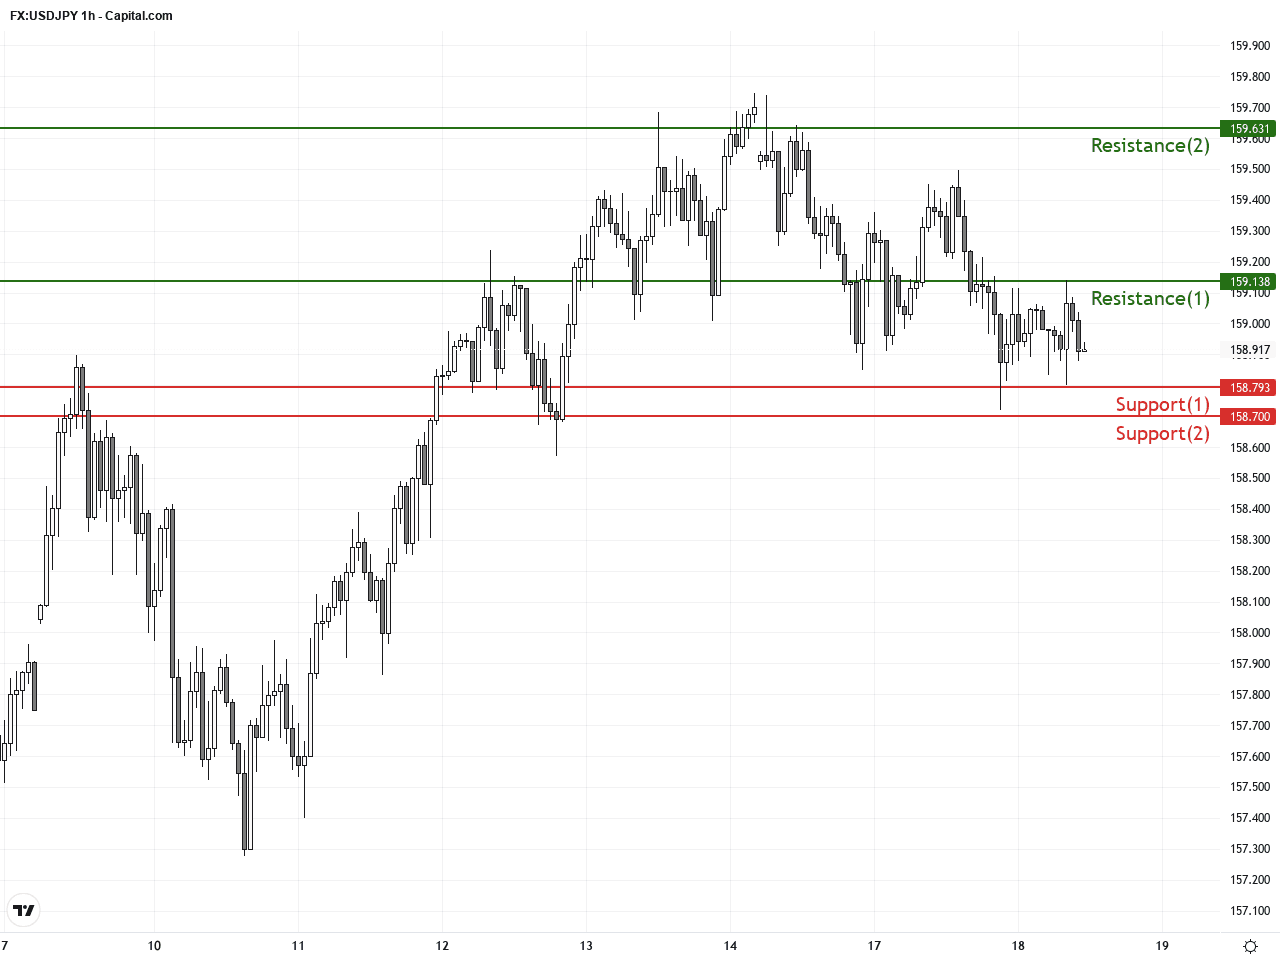
Over the past 24 to 48 hours, USD/JPY showed a slight downward trend, hovering near 158.9, compared to the previous closing price of 158.973. The pair’s intraday low hit 158.793, while the high reached 159.138. The market displayed limited volatility, mainly driven by falling U.S. Treasury yields alongside a rebound in risk appetite.
Recent news highlights the dollar surrendered its overnight gains on Tuesday, pressured by declining T-note yields and weaker-than-expected ADP employment data indicating the smallest job gains in five weeks. This dampened expectations of aggressive Federal Reserve tightening. Meanwhile, strengthening global stock markets reduced safe-haven demand for the dollar, capping USD/JPY upside.
For average investors, this situation can be likened to holding dollars that have lost a bit of their appeal as the economic outlook seems less strong than before, and with stocks doing well, fewer people feel the need to buy dollars as a safety net, resulting in a slight dip against the yen.
Additionally, the market is cautiously awaiting the Federal Reserve and Bank of Japan policy meetings, with investor sentiment remaining guarded as participants look for clues on future interest rate moves. In summary, the recent dollar softness was mainly driven by falling Treasury yields and improved risk appetite, while the yen lacked strong safe-haven support. The evolving interest rate differentials and policy uncertainty are likely to continue dictating USD/JPY movements.

The USDJPY daily chart shows a sustained long-term uptrend with price consistently above the 50-day moving average (~156.34) and 200-day moving average (~151.65). Bollinger Bands suggest expanding volatility but recent days show compression, indicating a consolidative triangle formation. The MACD remains positive but momentum has waned, suggesting temporary pause in bullish conviction. Overall, the trend remains bullish, but price is building a triangle pattern that could precede a significant breakout, warranting close monitoring of breakout levels.

On the 4-hour and hourly charts, USDJPY is exhibiting a mild downtrend over the past 3-5 days. Price has been capped near 159.1 and short-term moving averages (9 EMA vs. 10 SMA) show a bearish crossover. MACD shows a bearish divergence and price is testing key support near 158.7. Bollinger Bands are tightening, indicating low volatility and indecision. A break below 158.7 could signal further downside, whereas a rebound above 159.1 could resume bullish momentum.
Technical Trend: Cautiously bullish consolidation
The dominant technical theme is the triangle consolidation visible on the daily chart, which started forming after the recent highs near 159.6. This pattern suggests indecision and lower volatility compression. On the hourly chart, bearish signals include the moving average crossover and MACD divergence, signaling short-term bearish momentum and testing near-term support at 158.7. A recent bearish engulfing candlestick near 158.9 also points to increased seller interest. Technical indicators imply cautious trading with a potential short-term pullback within a broader bullish context.Key economic events today (GMT+1) include Japan’s February trade balance, which reported a surprising 57.3 billion JPY surplus, significantly better than the forecasted 485 billion JPY deficit, along with exports rising 4.2% year-over-year and imports up 10.2%. These data provide potential temporary support to the yen, but rising oil prices remain a headwind. Later US events such as the Producer Price Index and the FOMC interest rate decision are the major catalysts that could drive volatility in USDJPY. Traders should focus on these releases for directional cues, especially given their timing aligns with Asian and US market overlap.
Resistance & Support
The above financial market data, quotes, charts, statistics, exchange rates, news, research, analysis, buy or sell ratings, financial education, and other information are for reference only. Before making any trades based on this information, you should consult independent professional advice to verify pricing data or obtain more detailed market information. 1uptick.com should not be regarded as soliciting any subscriber or visitor to execute any trade. You are solely responsible for all of your own trading decisions.