


 |
| Gold V.1.3.1 signal Telegram Channel (English) |

USDJPY Slides Below 158 as Yen Strength Dominates: Key Support and Resistance Levels
2026-03-20 @ 11:01
Over the past 48 hours, the USD/JPY currency pair has experienced a notable decline, sliding back from yesterday’s closing price of 158.303 to around 157.80, down approximately 1.25%. This downward movement was primarily driven by broad strengthening in the Japanese yen.
Recent market news highlights that while the Federal Reserve maintained a hawkish stance and the US Dollar Index (DXY) continued its short-term rally, support for the dollar was limited against the yen. Hawkish comments from the Bank of England, European Central Bank, and Bank of Japan collectively boosted the yen alongside major currencies like the euro and pound, placing pressure on the dollar. Moreover, concerns about potential foreign exchange intervention by Japan’s Ministry of Finance as USD/JPY neared the 160 level further weighed on the pair.
For the average investor, this scenario can be understood as follows: despite the US maintaining relatively hawkish interest rate policies, the yen’s safe-haven appeal has recently surged amid heightened inflation concerns and geopolitical risks. This is similar to choosing between two assets—one performing strongly but with rising risks, the other more stable but less volatile. In uncertain times, investors tend to favor the safer option, which has lent strength to the yen and caused USD/JPY to fall.

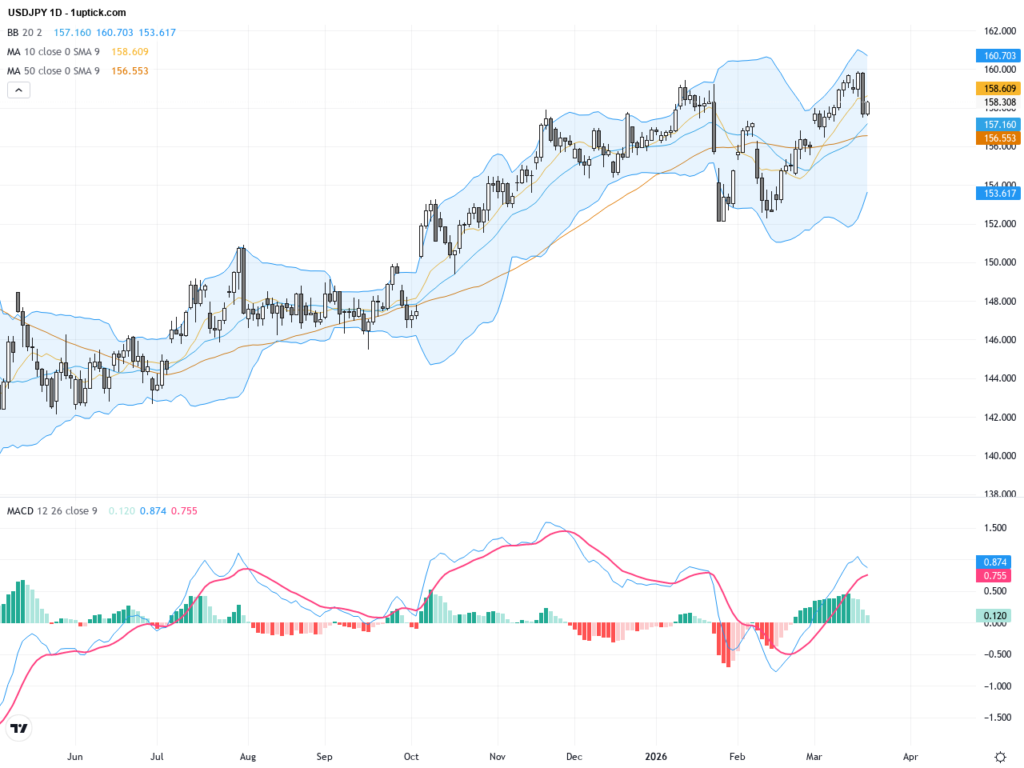
The daily chart shows USDJPY pulling back gradually from its year high near 159.89, with price oscillating between 158 and 156 in recent sessions. The 50-day moving average (approx. 156.14) remains above the 200-day (approx. 153.23), maintaining a long-term bullish structure, though short-term price action nears support zones and volatility tightens as Bollinger Bands contract. The MACD indicator is showing signs of losing bullish momentum as signal and MACD lines converge, signaling possible short-term pullback. The longer-term trend favors bulls but watch for potential short-term corrections.
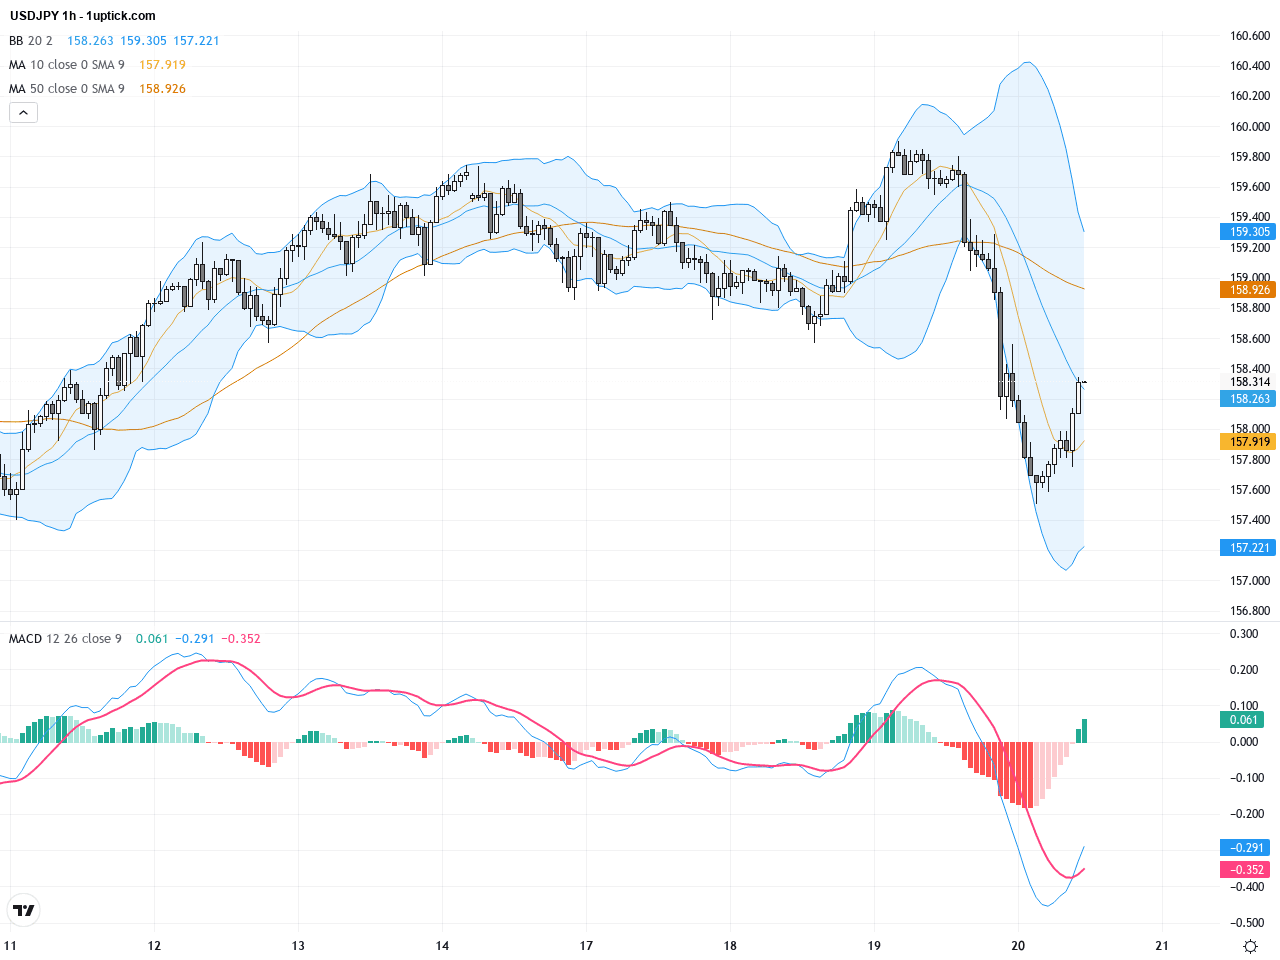
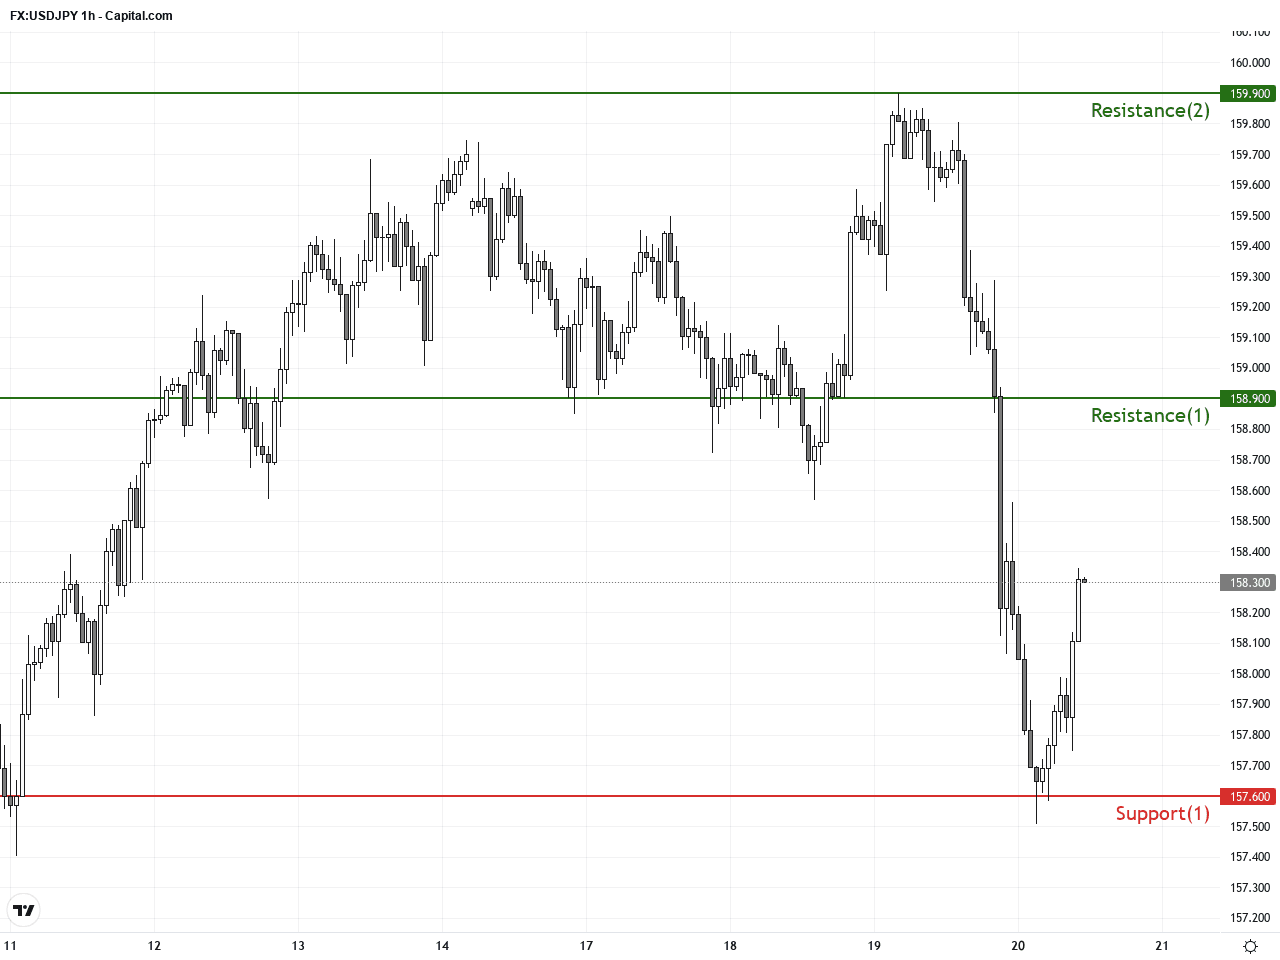
On the hourly chart over the last 3–5 days, USDJPY declined from around 158.90 to near 157.80, failing to sustain recent breakouts above resistance. The 20- and 50-period simple moving averages show mixed signals, reflecting short-term momentum divergence. A bearish MACD crossover suggests increasing short-term selling pressure. The Bollinger Bands middle band slopes downward, with price frequently testing the lower band and bouncing, indicating intensified selling pressure. It is critical to observe if support holds or if further downside momentum will develop.
Technical Trend: The overall trend is cautiously bearish with near-term weakness and ongoing sideways volatility. The medium- to long-term remains bullish but risks of intervention and swings demand vigilance.
Technically, USDJPY’s daily MACD weakening and price retreat highlight a correction phase following a momentum peak. The hourly chart’s bearish MACD cross and price trading below short-term moving averages point to near-term bearish bias. There are no notable reversal candlestick patterns yet; watch for break of key support levels to confirm deeper pullback risk. Traders should monitor interplay between resistance and support with market sentiment for high-probability setups.Today’s economic calendar in GMT+1 does not feature any directly relevant economic data impacting USDJPY. Key European trade and business indices (Italy trade balance, EU current account) are scheduled but have limited effect on USDJPY. In Asia, China’s steady 1-year loan rate and South Korea’s unemployment data are low-impact. Hence, USDJPY price action today will predominantly be driven by technical factors and risk sentiment rather than fundamental releases.
Resistance & Support
The above financial market data, quotes, charts, statistics, exchange rates, news, research, analysis, buy or sell ratings, financial education, and other information are for reference only. Before making any trades based on this information, you should consult independent professional advice to verify pricing data or obtain more detailed market information. 1uptick.com should not be regarded as soliciting any subscriber or visitor to execute any trade. You are solely responsible for all of your own trading decisions.