


 |
| Gold V.1.3.1 signal Telegram Channel (English) |

WTI Crude Oil: Sharp Pullback After Geopolitical Optimism Signals Key Support Levels Ahead
2026-03-10 @ 06:03
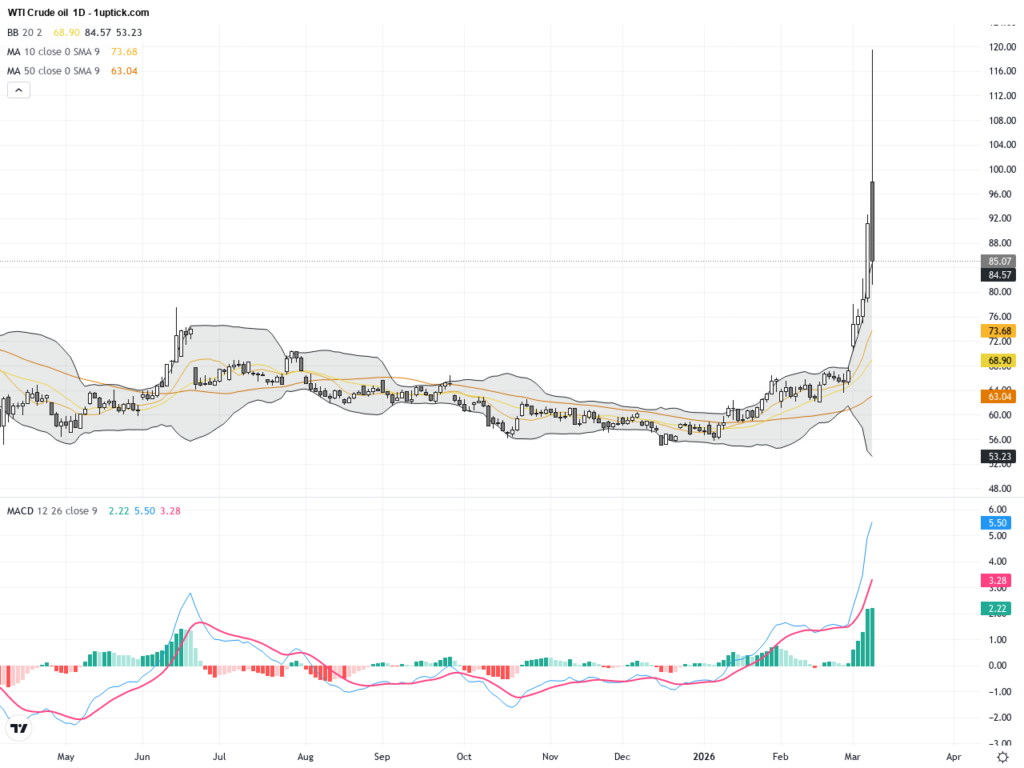
Over the past 24 to 48 hours, WTI Crude Oil prices have experienced significant volatility. Prices plunged nearly 26% from a closing price of $115.58 on March 8 to $85.08 on March 9. This dramatic swing was largely driven by geopolitical tensions in the Middle East. Initially, oil surged to a four-year high, even surpassing $120 per barrel amid escalating conflict between the US and Iran. However, following former President Trump’s statement that the war is “very complete,” market sentiment quickly shifted, sending prices plummeting.
Trump’s comments directly alleviated concerns about a prolonged conflict and supply disruptions, prompting investors to rapidly recalibrate their positions and driving the sharp price decline. This move reflects a shift from heightened panic to cautious relief, demonstrating how geopolitical risks heavily impact oil markets in the short term but can quickly reverse with new developments.
For the average investor, this was akin to riding a rollercoaster: soaring on the fear of war one moment, then plunging on hopes for an imminent end the next. Such extreme swings underscore that oil prices remain highly sensitive to political news, and investment decisions should carefully weigh the risks involved in such a volatile environment.

The WTI daily chart reveals a strong uptrend from early March, peaking at $119.48 before a sharp correction. Moving averages still show a short-term bullish bias, but prices have recently dipped below the Bollinger Bands’ middle band, indicating surging volatility. The MACD, which had formed a bullish crossover, is now retreating, signaling weakening medium-term momentum. Overall, the daily trend reflects increased correction pressure without a definitive long-term reversal yet.
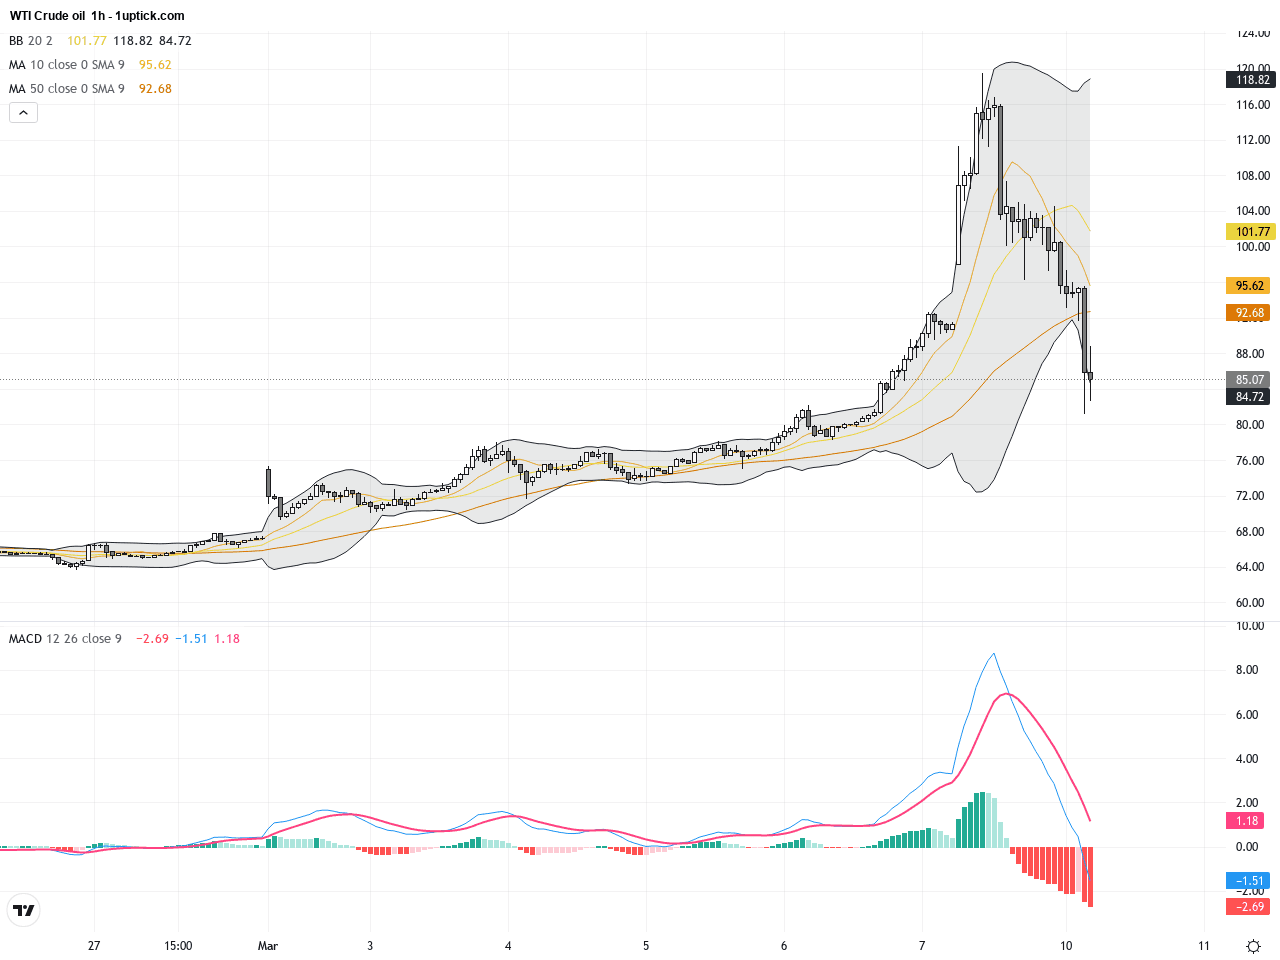
On the hourly chart, WTI shows pronounced fluctuations over the past 3-5 days, forming a clear head and shoulders pattern with its peak on the afternoon of March 8th, followed by a break below neckline support. Bollinger Bands contracted before expanding rapidly, reflecting heightened short-term volatility. A recent MACD death cross combined with RSI entering oversold territory hints at a possible technical bounce, but the trend remains corrective. Watch for a reclaim of neckline resistance to confirm a shift back to bullishness.
Technical Trend: WTI Crude Oil is currently in a volatile consolidation phase with a cautious sideways bias.
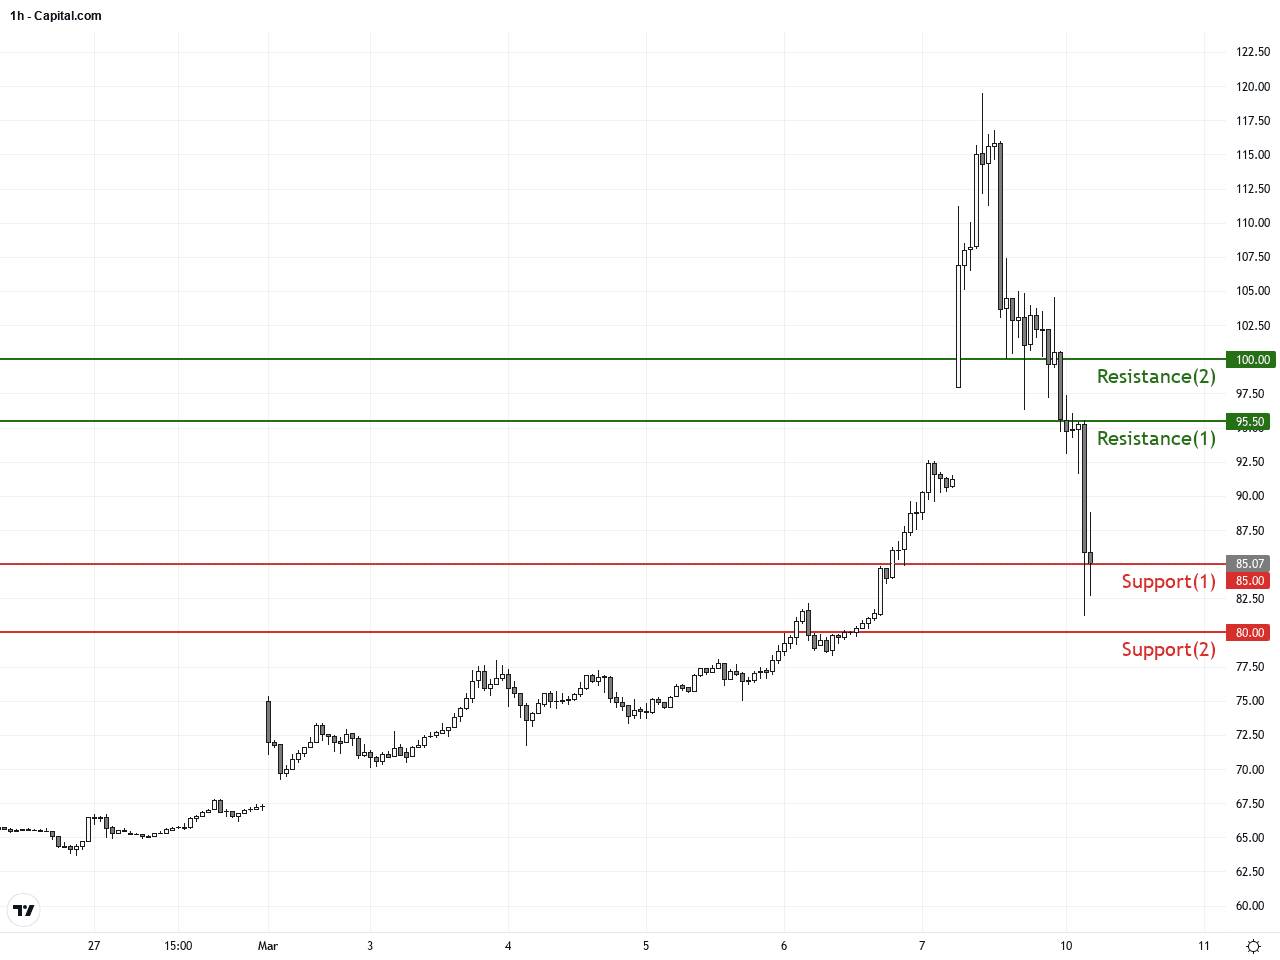
WTI currently faces crashing prices amid geopolitical easing. The head and shoulders formation warns of downside risk, but oversold RSI and MACD conditions signal a near-term rebound potential. Traders should closely monitor the critical support level near $85 and observe if prices can regain the Bollinger Bands middle line to restore bullish momentum.There are no significant or direct economic events scheduled today that would impact WTI Crude Oil prices. Market movements will likely continue to be driven by geopolitical developments and technical factors.
Resistance & Support
The above financial market data, quotes, charts, statistics, exchange rates, news, research, analysis, buy or sell ratings, financial education, and other information are for reference only. Before making any trades based on this information, you should consult independent professional advice to verify pricing data or obtain more detailed market information. 1uptick.com should not be regarded as soliciting any subscriber or visitor to execute any trade. You are solely responsible for all of your own trading decisions.