 |
| Gold V.1.3.1 signal Telegram Channel (English) |

WTI Crude Oil Surges Past $100 Driven by Middle East Tensions: Trading Outlook & Technical Analysis
2026-03-31 @ 06:03
Over the past 24 to 48 hours, WTI crude oil prices saw a significant rise, breaking above the $100-barrel mark for the first time since 2022. The closing price on March 30 was $104.98, demonstrating solid gains compared to the previous trading day. This upward momentum was primarily driven by escalating tensions in the Middle East, notably reports of Yemen’s Houthis firing missiles at Israel, which heightened fears of supply disruptions in the oil market.
Furthermore, potential US strikes on Iran’s energy assets and reports indicating that repairing infrastructure following an Iran conflict could take years have intensified investor concerns about the security of oil supply. These factors combined have propelled WTI crude futures sharply higher, with the market becoming more sensitive and volatile amid rising geopolitical risks.
For the average investor, this translates into ongoing pressure on fuel prices and the likelihood of increased inflationary effects globally. As the market continues to digest developments in the Middle East, WTI crude oil price fluctuations will remain a critical factor influencing investment decisions in the near term.
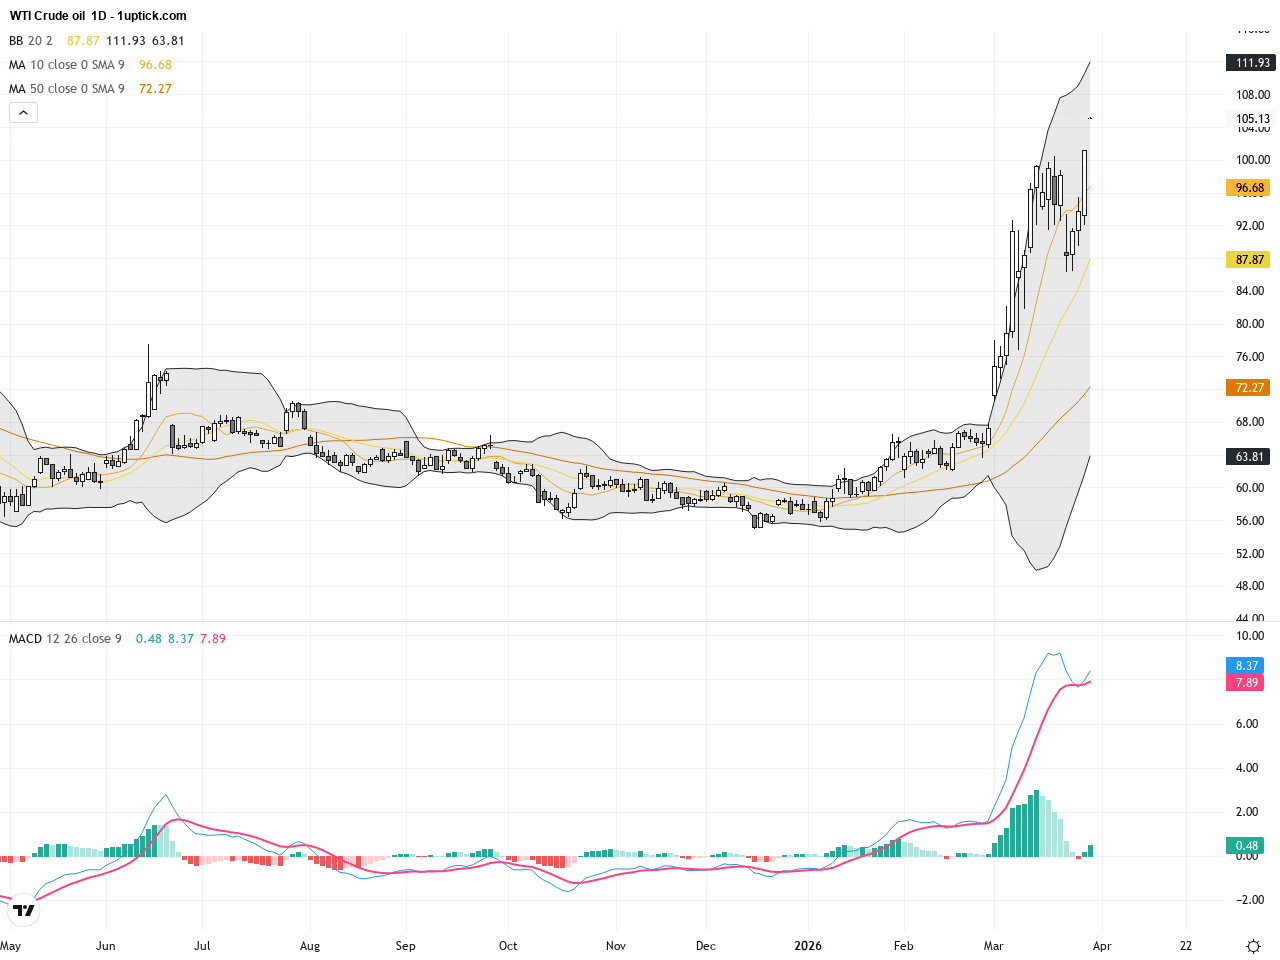
The daily chart reveals a sustained uptrend since mid-March, with prices steadily breaking key resistance levels and establishing firm support around the $104 mark. The Bollinger Bands indicate expanding volatility, while short-term moving averages (10 and 20 EMA) are aligned bullishly. The MACD remains above the zero line, increasing the gap, suggesting strong momentum and a robust longer-term uptrend.
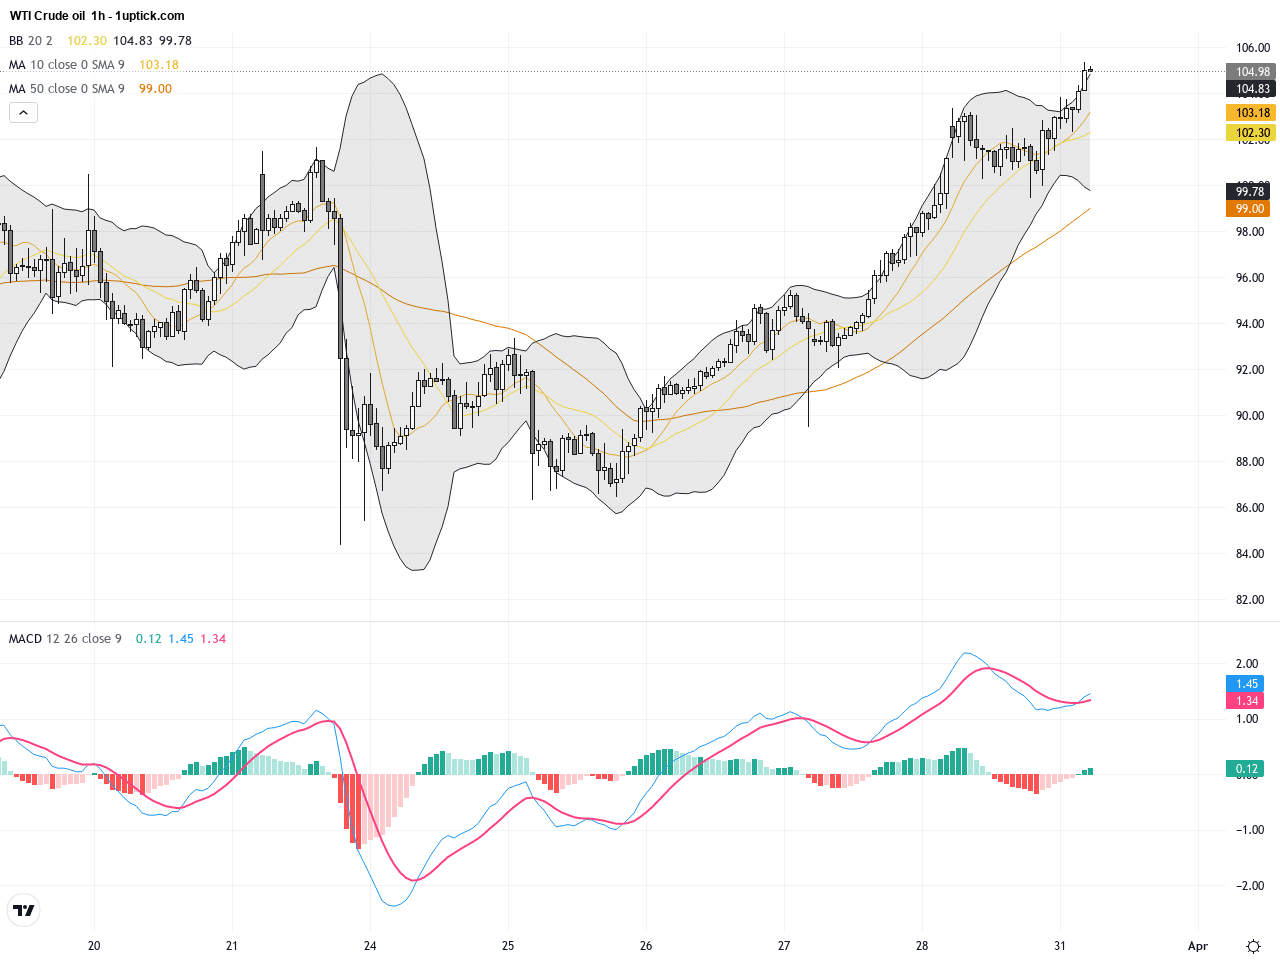
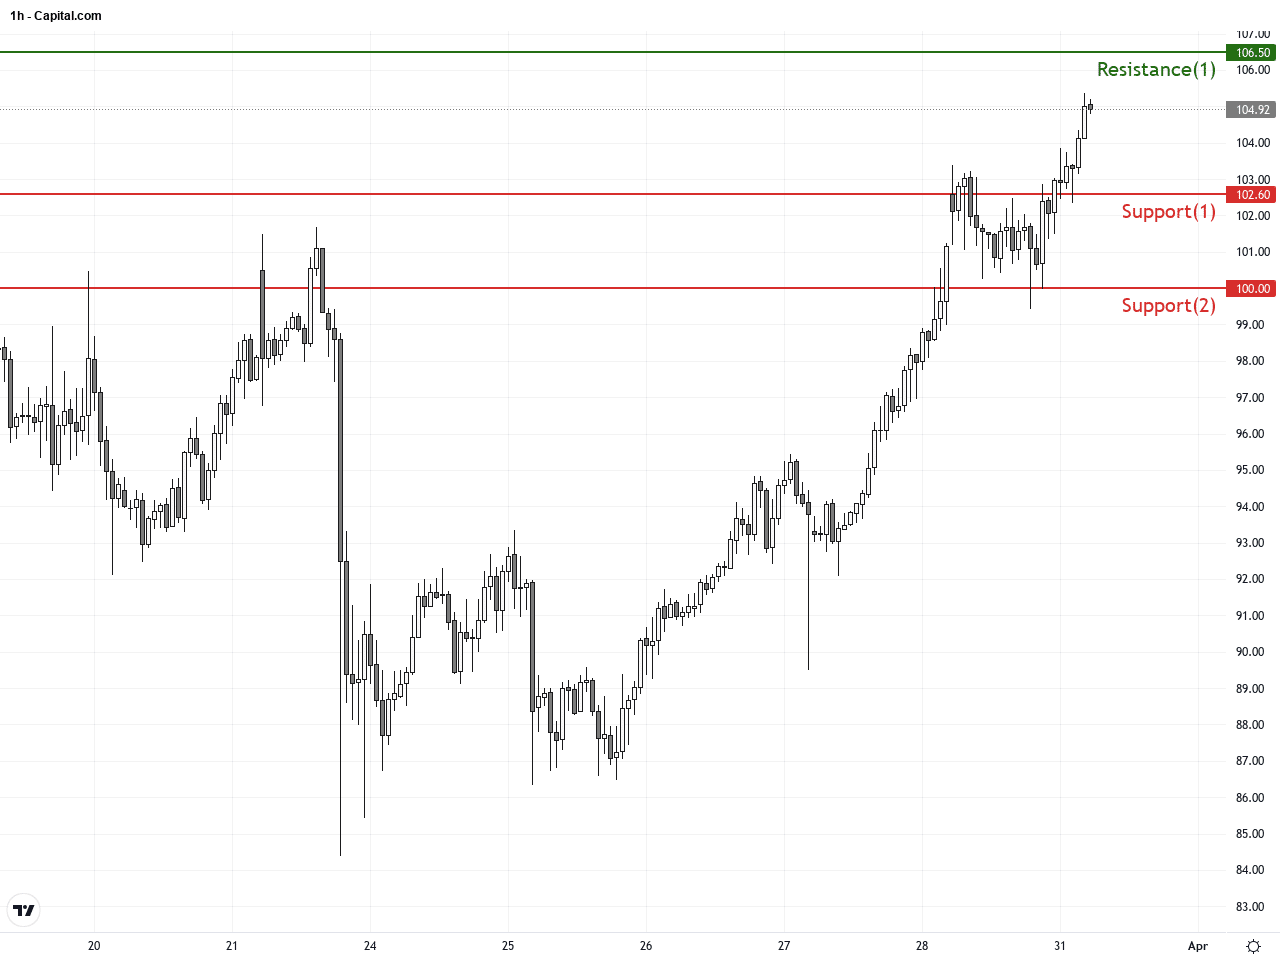
In the last 3-5 days on the hourly chart, WTI shows clear breakouts followed by consolidation phases. Price action remains near the upper Bollinger Band, indicating short-term momentum pauses but sustained bullish bias. The MACD is approaching a bullish crossover, and moving averages provide solid support, implying favorable conditions for buyers in the near term and potential breakout scenarios post consolidation.
Technical Trend: WTI Crude Oil is currently in a decisively bullish trend, supported by sustained momentum indicators and positive market sentiment.
Technical indicators confirm a strong bullish trajectory for WTI, with MACD continuing positive expansion and RSI approaching overbought territory near 70. The recent bullish engulfing candlestick signals buyer dominance in the short term. Watch for Bollinger Band expansion, as breaking above the upper band could trigger a sharp accelerated move higher.There are no significant or directly relevant economic events scheduled today impacting WTI Crude Oil. Traders should remain vigilant toward geopolitical developments or unexpected supply disruptions that traditionally influence oil prices more heavily.
Resistance & Support
The above financial market data, quotes, charts, statistics, exchange rates, news, research, analysis, buy or sell ratings, financial education, and other information are for reference only. Before making any trades based on this information, you should consult independent professional advice to verify pricing data or obtain more detailed market information. 1uptick.com should not be regarded as soliciting any subscriber or visitor to execute any trade. You are solely responsible for all of your own trading decisions.