


 |
| Gold V.1.3.1 signal Telegram Channel (English) |

XAUUSD: Gold Breaks Below 100-Day MA Amid Sharp Selloff and Technical Breakdown
2026-03-20 @ 05:03
Over the past 24 to 48 hours, gold (XAUUSD) has undergone a significant selloff, dropping about 5% from the previous close of 4655.725 USD on March 19, breaking below the critical 100-day moving average. This recent plunge comes amid fading safe-haven demand and a reassessment of the Federal Reserve’s stance.
Market reports indicate that gold broke through a key support level at $4,960, triggering a medium-term downtrend. Rising U.S. Treasury yields and surging oil prices have further diminished gold’s appeal as a safe-haven asset. Traders are now awaiting Fed Chair Powell’s remarks for clearer direction on gold’s next move.
For the average investor, this means heightened volatility in the gold market and a temporary retreat in safe-haven buying. If you hold gold-related stocks or ETFs, keep an eye on Federal Reserve policies and upcoming economic data to adapt your investment approach accordingly.
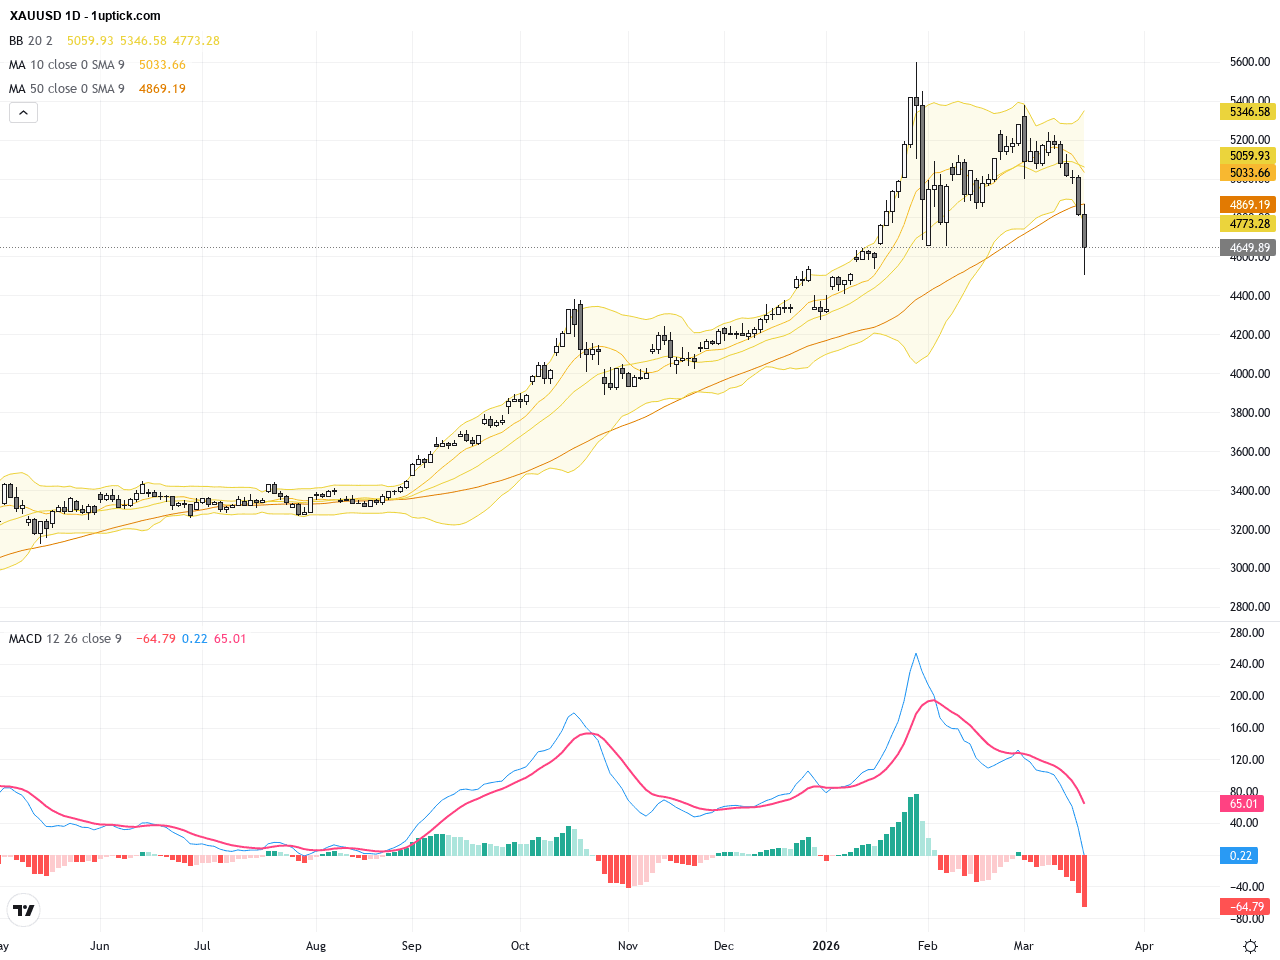
The daily chart reveals a clear downtrend for XAUUSD over recent weeks, with prices decisively breaking under both the 50-day and 100-day moving averages. The MACD indicator formed a bearish crossover, and the Bollinger Bands expanded, pointing to increased volatility within a prevailing bearish trend. Since March 17, gold’s sharp drop depicts strong selling pressure, with little evidence of near-term upward resistance. This confirms a medium-term bearish regime requiring caution from investors and traders.
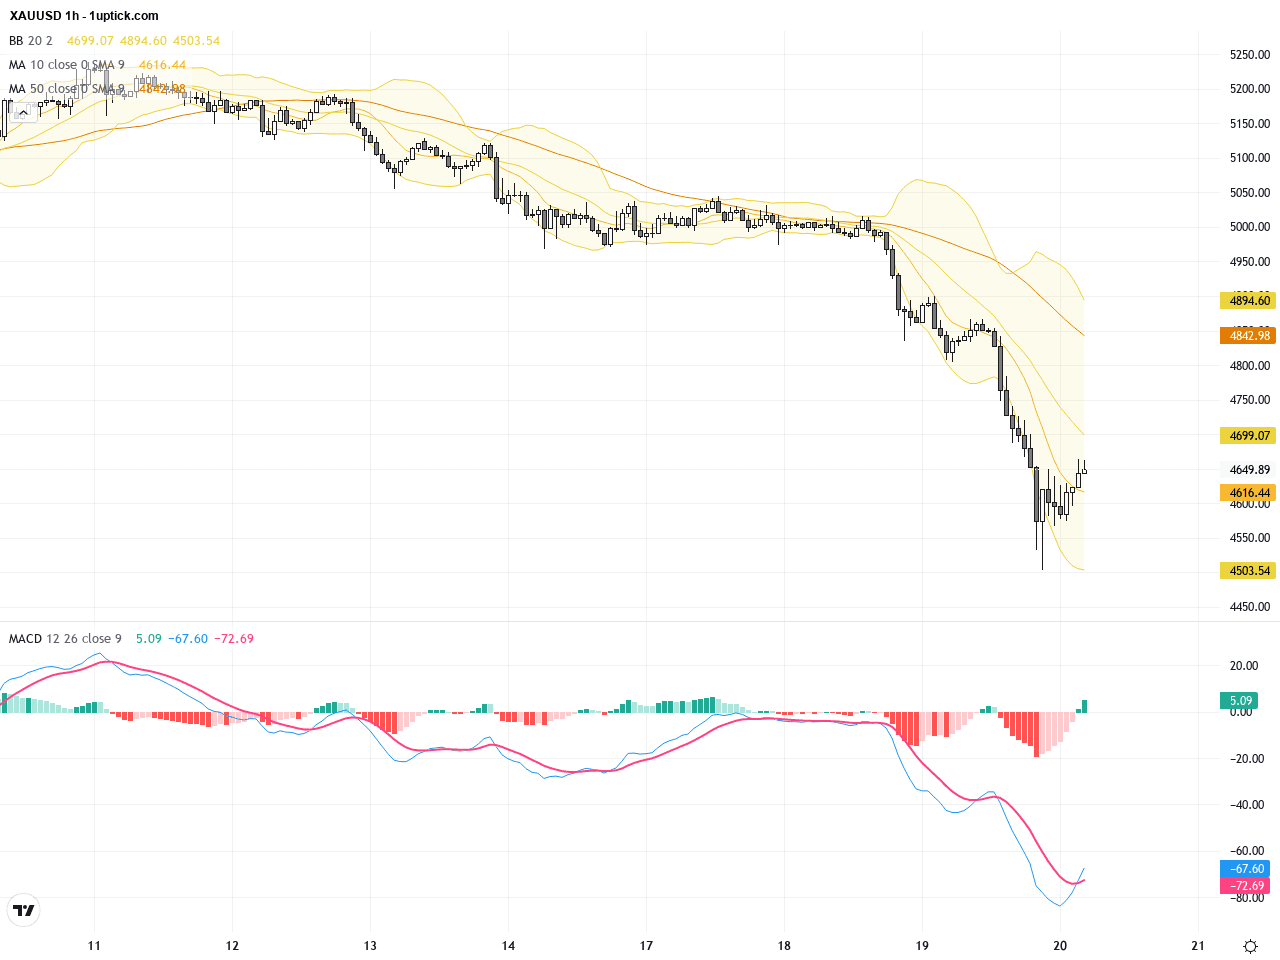
The hourly chart over the past 3-5 days shows volatile price action with multiple failed rebound attempts capped at moving averages and Bollinger Bands midlines. The MACD momentum remains negative, and the formation of a descending flag pattern on March 19 hints at further potential drops following the consolidation. Candlestick patterns also reveal long lower wicks suggesting short-term buying interest but no confirmed reversal signal.
Technical Trend: The overall trend is clearly bearish in the medium term with short-term volatile consolidations, best described as a ‘tentative bearish phase’.
Technically, with gold breaking below the critical 100-day moving average and the $4,960 support, the risk of further decline intensifies. A bearish MACD crossover points to weakening momentum, while the expanded Bollinger Bands signal rising volatility. Hourly chart’s descending flag suggests consolidation before a possible breakout lower. Although recent candlesticks show some rejection with long lower shadows, no reversal is confirmed yet. Traders should monitor volume and breakout confirmations closely to gauge next moves.Today’s economic calendar features stronger-than-expected Japanese industrial production and an unchanged Bank of Japan interest rate, indirectly influencing safe-haven flows. Australia reported robust employment data boosting risk sentiment. Key rate and employment figures from the UK and US are scheduled but not directly impactful for XAUUSD today. Overall, no major immediate economic events will directly move gold prices, but the broader market preference for USD and yields remains the main driver.
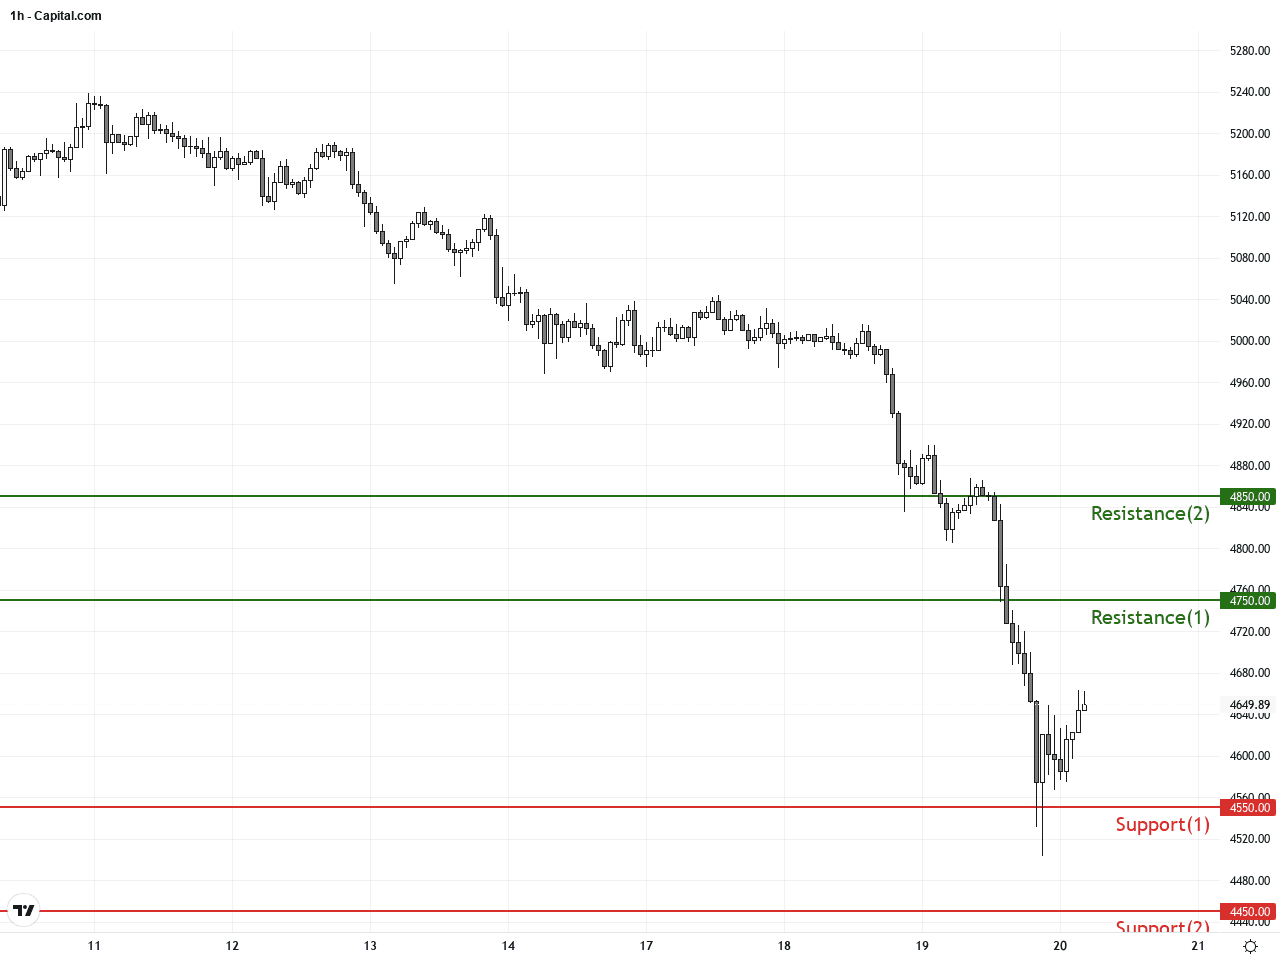
Resistance & Support
The above financial market data, quotes, charts, statistics, exchange rates, news, research, analysis, buy or sell ratings, financial education, and other information are for reference only. Before making any trades based on this information, you should consult independent professional advice to verify pricing data or obtain more detailed market information. 1uptick.com should not be regarded as soliciting any subscriber or visitor to execute any trade. You are solely responsible for all of your own trading decisions.