

 |
| Gold V.1.3.1 signal Telegram Channel (English) |

XAUUSD Gold: Key Support Testing Amid Technical Rebound and Trading Outlook
2026-03-10 @ 05:04
In the past 48 hours, the gold market (XAUUSD) has experienced notable volatility and adjustments. Closing at 5137.91 USD on March 9, the price showed a slight rebound from the previous day but remained under pressure overall. The surge in oil prices to multi-year highs influenced gold, causing a pullback as investors shifted funds between energy and precious metals.
Recent market news titled “Gold (XAUUSD), Silver, Platinum Forecasts – Gold Pulled Back As Oil Tested Multi-Year Highs” highlighted that soaring oil prices raised concerns over inflation and geopolitical risks. This prompted some capital to move away from gold toward energy assets, temporarily pressuring gold prices. Coupled with a stronger US dollar and rising interest rate concerns, gold’s appeal as a safe haven softened further.
For average investors, this means that although gold remains a key hedge amid geopolitics and global energy uncertainties, its price has become more volatile in the short term. Blindly chasing higher prices may not be advisable. Going forward, gold prices are likely to fluctuate in line with economic data and evolving market conditions, so close market monitoring and cautious positioning are recommended.
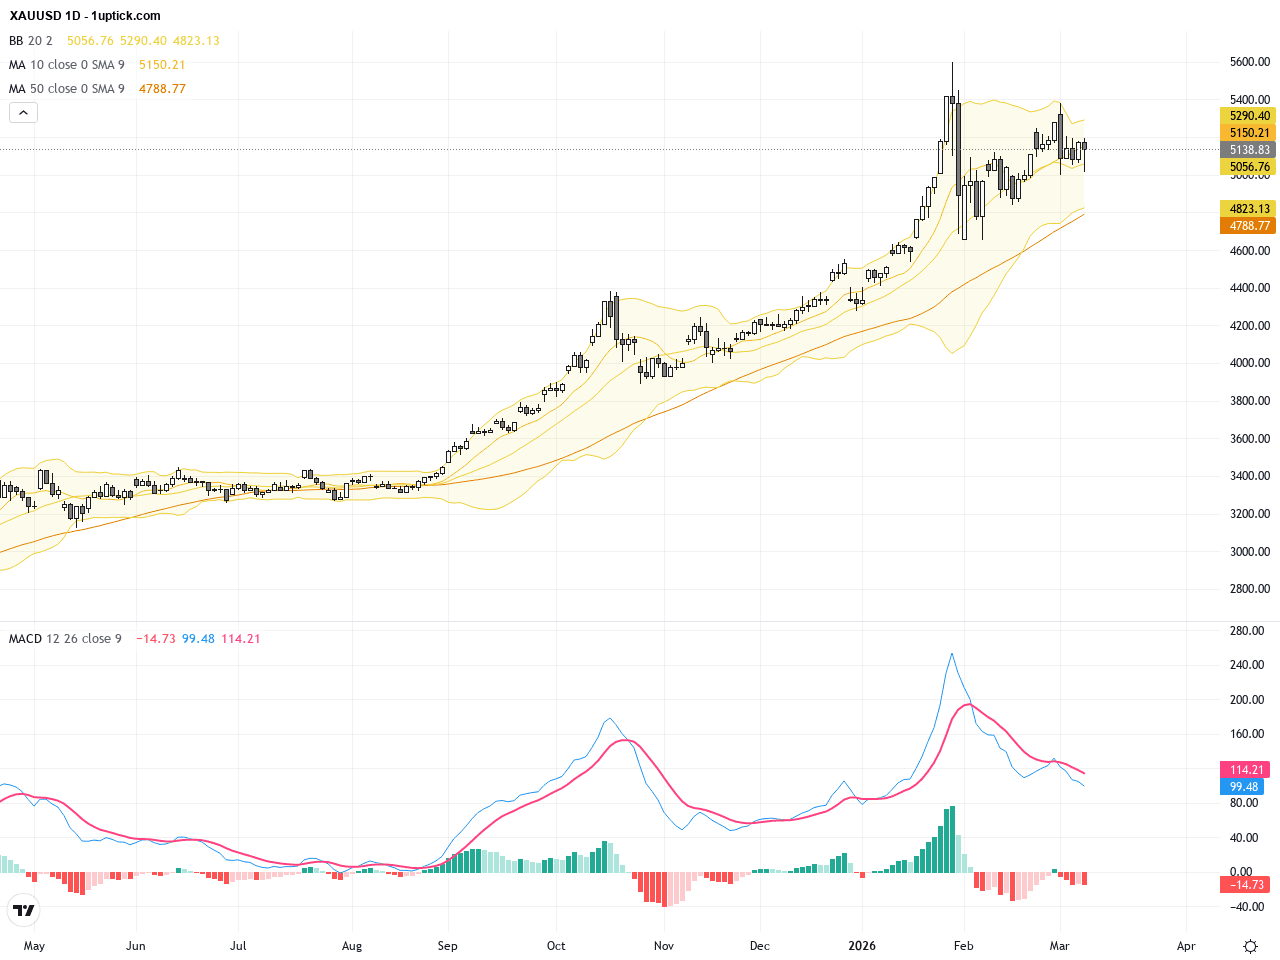
The daily chart illustrates XAUUSD retreating from around 5170 to near 5130, indicating a corrective phase. Price is approaching key moving average support, with the MACD showing a slowdown in bullish momentum but no immediate crossover bearish signals. Bollinger Bands’ lower band is providing support. This suggests a short-term range-bound market without a confirmed trend reversal yet. Overall, the longer-term outlook remains cautiously bullish, provided the support zones hold firm.
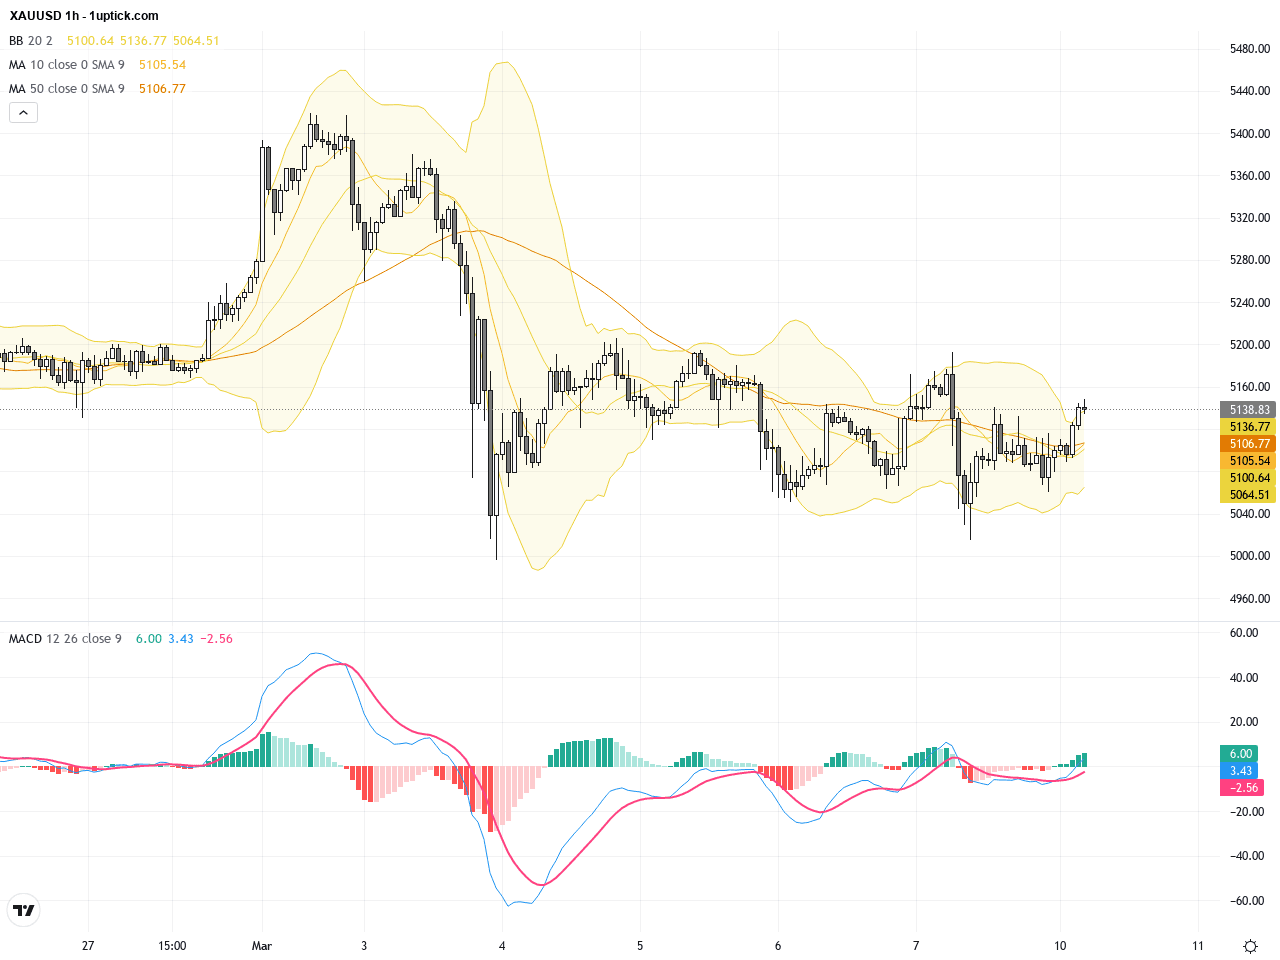
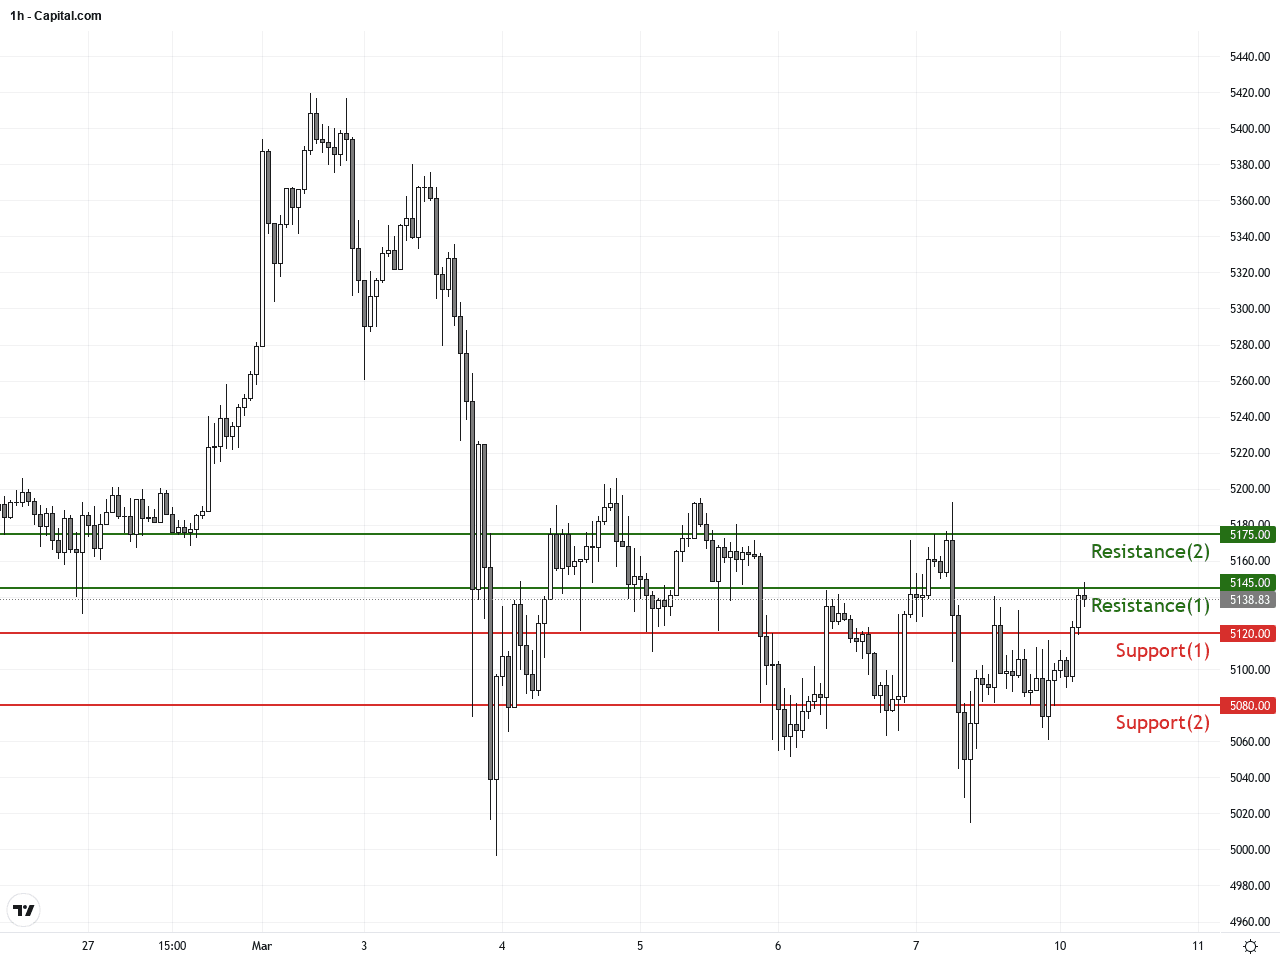
Examining the last 3-5 days on the hourly chart, XAUUSD shows a mild pullback with multiple hammer candlesticks and lower shadows indicating support-building. The MACD histogram is shrinking, signaling weakening bearish momentum. The Bollinger Bands are narrowing, a classic sign of imminent volatility expansion. Short-term moving averages are converging, so a break above resistance near 5145 could spark a rebound, but a fall below 5120 might trigger further declines.
Technical Trend: Consolidation with pullback
Technically, XAUUSD remains in a consolidation and mild corrective phase. Watch for MACD histogram reductions and the Bollinger Bands squeezing, which suggest lower volatility is ending and a breakout may be imminent. Recent candlestick patterns like hammer formations indicate underlying support, but the absence of definitive head & shoulders or triangle patterns advises trading cautiously using key support and resistance levels as guides while awaiting clearer confirmations.Today’s economic calendar reveals no major US data releases directly impacting XAUUSD. Key Asian and European releases such as Japan’s current account and China’s inflation (CPI and PPI) came in mixed but generally neutral, offering little immediate catalyst for gold. Traders should keep monitoring global energy sector developments and Federal Reserve policy signals for primary market-moving events.
Resistance & Support
The above financial market data, quotes, charts, statistics, exchange rates, news, research, analysis, buy or sell ratings, financial education, and other information are for reference only. Before making any trades based on this information, you should consult independent professional advice to verify pricing data or obtain more detailed market information. 1uptick.com should not be regarded as soliciting any subscriber or visitor to execute any trade. You are solely responsible for all of your own trading decisions.