


 |
| Gold V.1.3.1 signal Telegram Channel (English) |

XAUUSD Gold Price Outlook: Dollar Strength and Rate Cut Delays Cap Rally
2026-03-13 @ 05:04
Over the past 24 to 48 hours, gold (XAUUSD) has experienced notable volatility, dropping from $5,176.48 on March 11 to close at $5,081.12 on March 12, reflecting multiple pressures in the market.
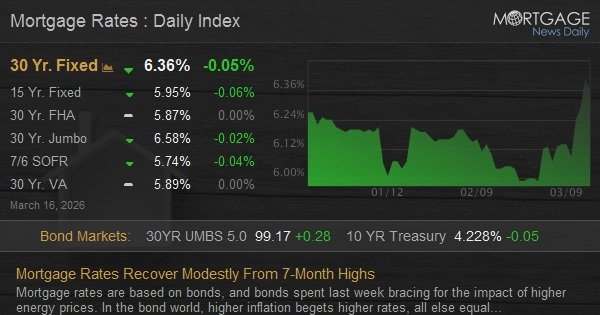
Recent market news highlights that gold prices were capped by a stronger US dollar, rising Treasury yields, and delayed Federal Reserve rate cuts. Inflationary pressures in the US persist, partly driven by elevated oil prices, delaying expectations of interest rate reductions and thus dampening gold’s safe-haven appeal. Meanwhile, geopolitical tensions increased trading volumes in gold, underscoring its role as a crucial asset during uncertain times.
For the average investor, this means that although rate cuts were anticipated to boost gold prices, the advancing dollar, higher bond yields, and ongoing Middle East tensions have temporarily restrained gold’s rally. Investors holding gold should closely monitor macroeconomic data and global oil price movements, as these remain key drivers of gold’s near-term price trajectory.
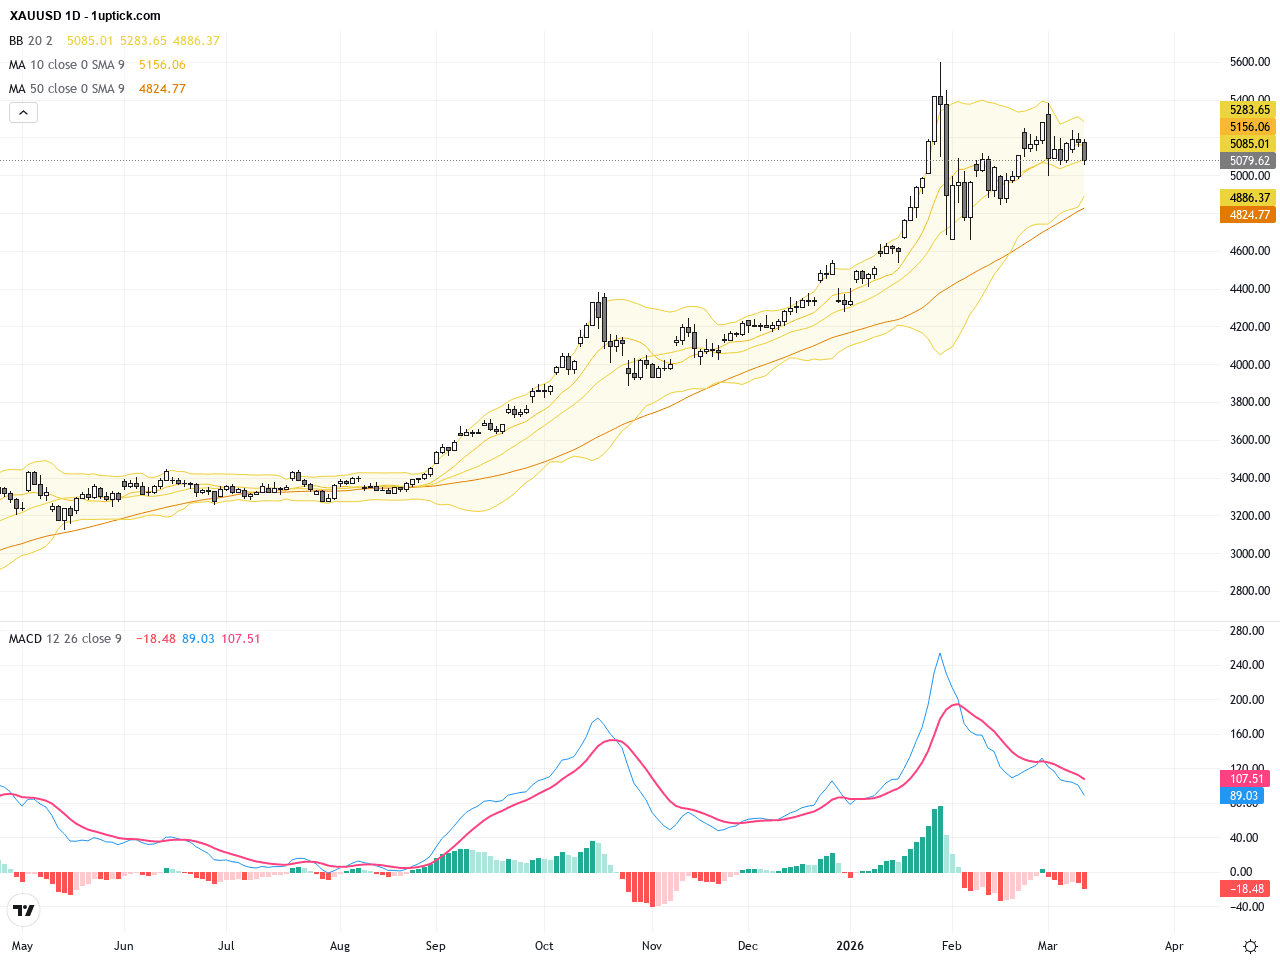
The daily chart shows XAUUSD in a downtrend and consolidation phase over the past month. The price has declined from around 5278 in late February to 5081 at close on March 12th, indicating weakening bullish momentum. The moving averages show a bearish crossover (short-term MA crossing below long-term MA), signaling medium-term bearish sentiment. Bollinger Bands are narrowing with price near the lower band, suggesting reduced volatility but remaining downside risk. MACD depicts negative divergence with declining momentum, signaling overall caution and potential for further retracement or consolidation.

The hourly chart over the last 3-5 days shows frequent price swings with a clear short-term downward bias. The 10 and 20 period EMAs are sloping downwards, confirming near-term bearish control. A descending triangle pattern has formed since March 9th, with lower lows on the hourly timeframe indicating the risk of a breakout to the downside. Recent candlesticks include hammer and bearish engulfing patterns, showing sellers have been applying strong pressure. MACD is below zero but beginning to converge, and RSI is near 40, implying a possible momentum slowdown and upcoming consolidation or short-term bounce opportunity.
Technical Trend: Cautiously bearish consolidation with potential volatility around key support and resistance levels
Technically, XAUUSD is at a critical juncture where bullish and bearish forces are fighting for control. The daily chart’s bearish crossover and descending trend highlight pressure on gold prices, while short-term support levels attempt to hold. The hourly descending triangle pattern signals possible continuation of short-term corrective moves. Momentum indicators like volume, RSI, and MACD suggest bears may still dominate but a short-term rebound could emerge. A cautious approach focusing on key technical signals for entry and exit points is recommended to capitalize on high-probability trade setups.Today’s global economic calendar features several releases from Europe and North America, including US building permits, trade balance, and jobless claims at 13:30 GMT+1. While these metrics relate to USD strength, there is no major economic event today expected to have an immediate direct impact on XAUUSD gold price, as the market remains more focused on Fed policy outlook and geopolitical risks. Traders should monitor upcoming FOMC officials’ speeches and energy market developments for potential catalysts.
Resistance & Support

The above financial market data, quotes, charts, statistics, exchange rates, news, research, analysis, buy or sell ratings, financial education, and other information are for reference only. Before making any trades based on this information, you should consult independent professional advice to verify pricing data or obtain more detailed market information. 1uptick.com should not be regarded as soliciting any subscriber or visitor to execute any trade. You are solely responsible for all of your own trading decisions.