 |
| Gold V.1.3.1 signal Telegram Channel (English) |
AUDUSD: Key Support Tested Amid Ongoing Downtrend – Technical & Fundamental Trading Outlook
2026-04-06 @ 06:01
Over the past 24 to 48 hours, the Australian Dollar against the US Dollar (AUD/USD) experienced notable volatility, closing yesterday at 0.68872. A speech by US President Trump has driven the US dollar higher, serving as a key catalyst influencing forex markets recently. Geopolitical tensions, especially in the Middle East, alongside uncertainties around US labor market data, have added downward pressure on the AUD/USD pair.
Moreover, the Reserve Bank of Australia’s (RBA) continued hawkish stance supports expectations for further US rate hikes, providing some support for the AUD. However, rising oil prices and geopolitical risks have boosted demand for the USD, weakening the AUD’s performance and causing the exchange rate to hover around 0.6860 with a slight dip. Investors remain cautious ahead of upcoming employment data and ongoing global trade tensions, reflecting heightened market sensitivity to volatility.
For the average investor, this volatility signals increased market sensitivity to international political and economic developments. When external pressures mount, particularly with a strong US dollar, risk currencies such as the AUD tend to weaken. Understanding these dynamics can help investors better seize opportunities amid currency fluctuations and manage potential risks effectively.

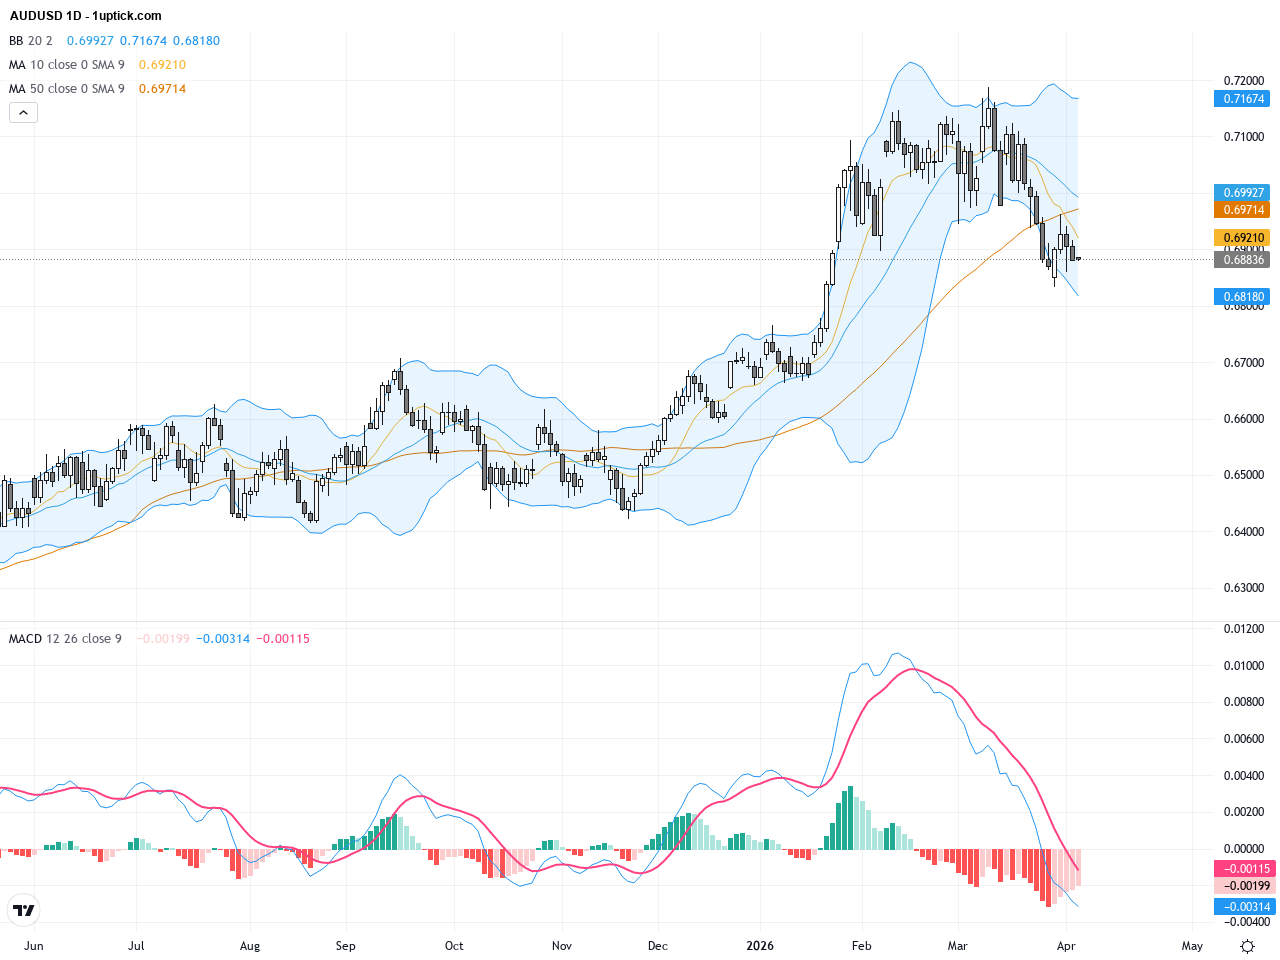
On the daily chart, AUDUSD displays a clear downtrend from its recent highs around 0.7123, steadily declining to the current area near 0.6887. The 21-day EMA slopes downward, confirming medium-term bearish momentum. Price has repeatedly failed to break above the 0.6910 resistance level, indicating solid selling pressure. The 100-day Simple Moving Average near 0.6775 serves as a key support reference. Bollinger Bands are tightening, implying a possible short-term consolidation, but the MACD remains below zero, underscoring sustained bearish dominance without clear reversal signals.
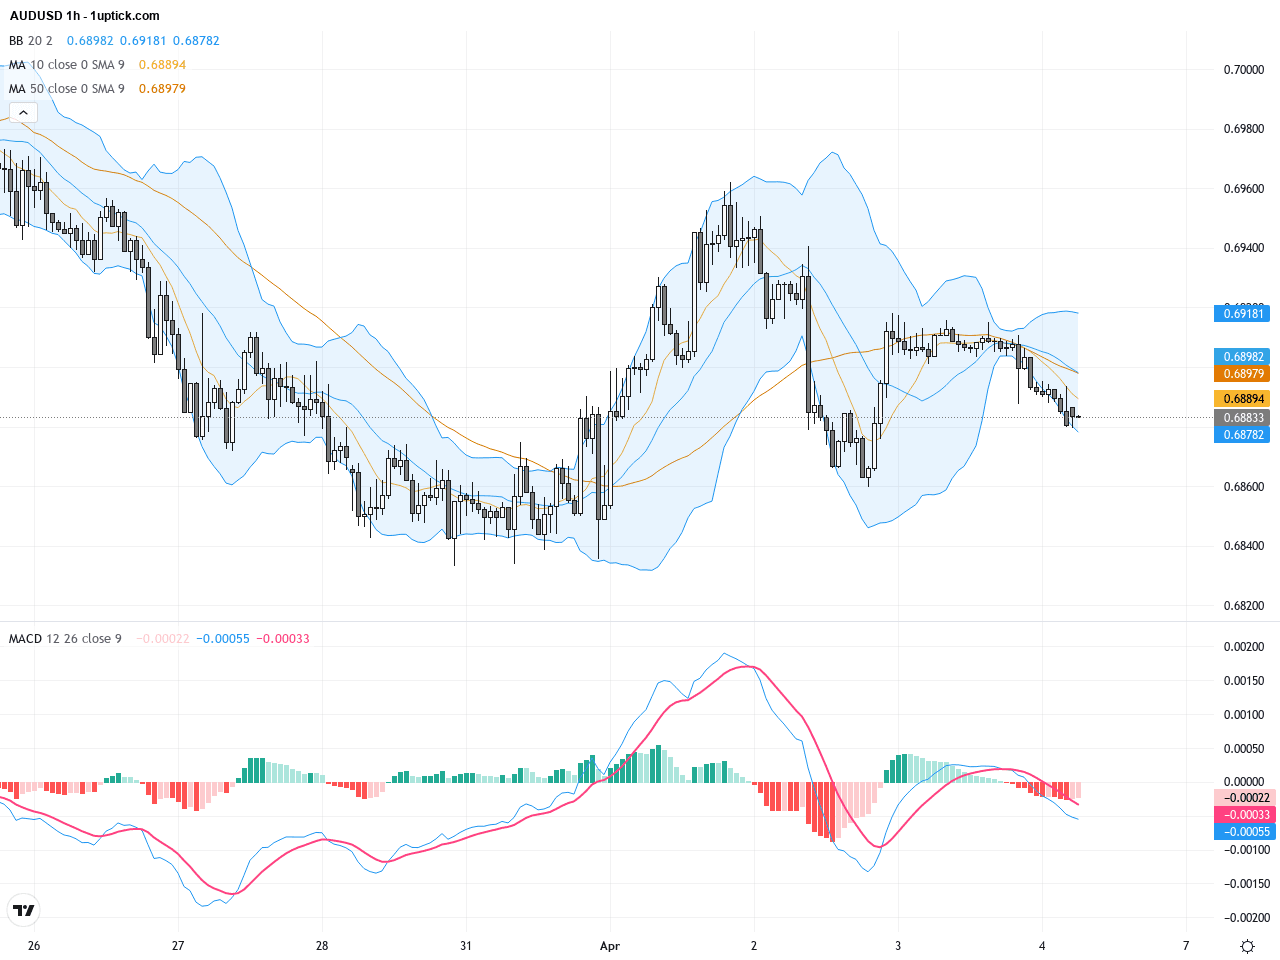
On the hourly chart covering the last 3-5 days, AUDUSD has been trading within a range of approximately 0.6835 to 0.6910, but with a prevailing short-term bearish momentum. Short moving average crossovers and a recent negative MACD divergence raise risk of further downside. Recent candlestick patterns featuring bearish engulfing formations highlight seller control, pointing to potential price declines in the next 24 hours. Traders should watch the key short-term support levels for breakout clues.
Technical Trend: Cautiously Bearish – The immediate trend is still driven by USD strength, and downside risks remain elevated.
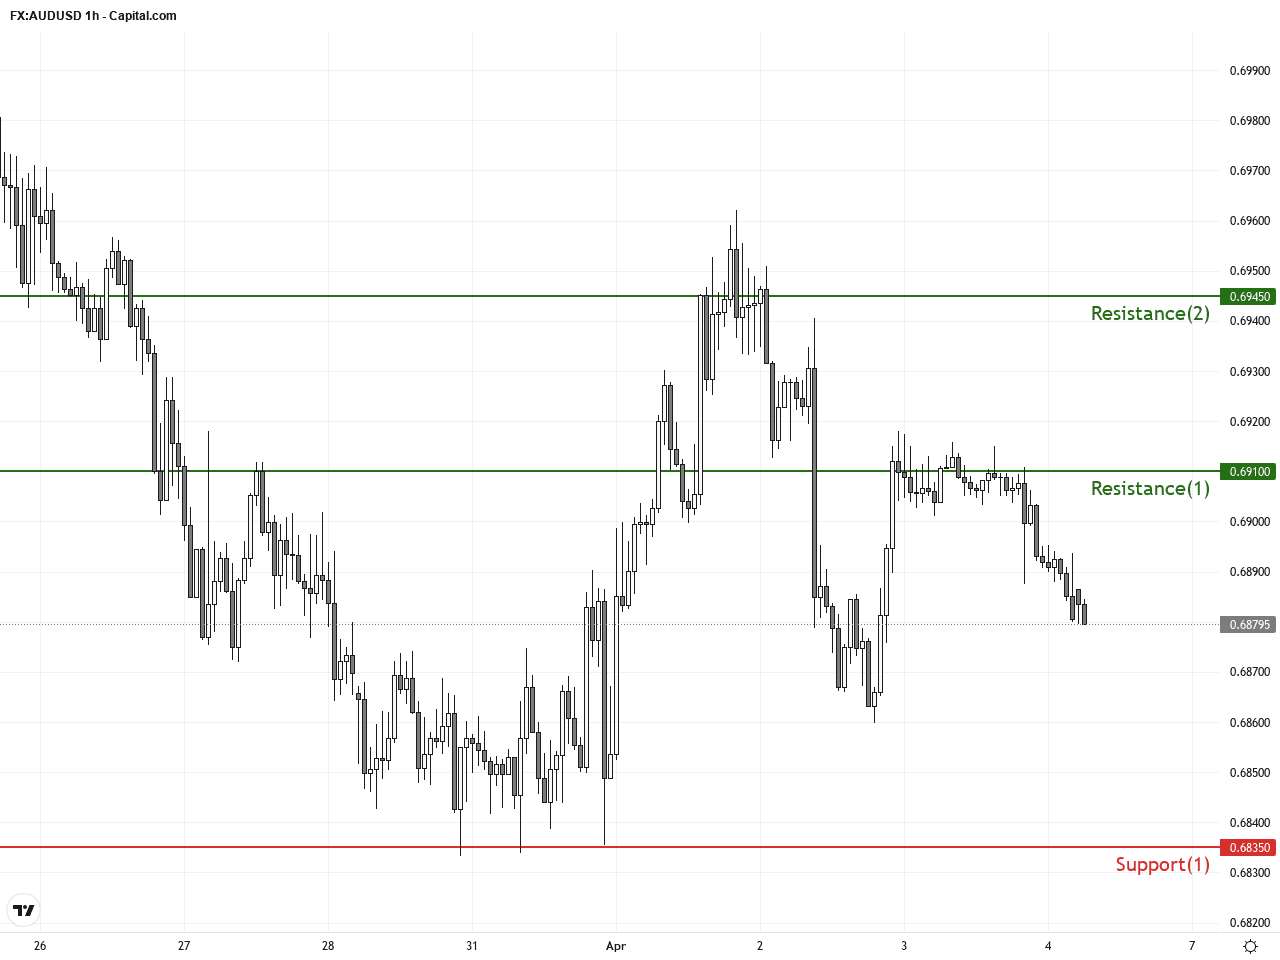
Technical indicators reinforce a bearish bias for AUDUSD, with MACD negative and RSI yet to enter oversold territory, suggesting further downside remains possible. The daily chart exhibits a descending triangle pattern, signaling the likelihood of continued downward pressure. Fundamentally, a strong USD is limiting any upside for the Australian dollar, reinforcing the short-term weak outlook. Close attention should be paid to the 0.6835 support level; a breakdown below this could trigger accelerated declines.There are no significant or directly relevant economic events scheduled today (GMT+1) that are likely to impact AUDUSD. Market participants should monitor geopolitical developments and liquidity conditions for their potential influence on the pair.
Resistance & Support
The above financial market data, quotes, charts, statistics, exchange rates, news, research, analysis, buy or sell ratings, financial education, and other information are for reference only. Before making any trades based on this information, you should consult independent professional advice to verify pricing data or obtain more detailed market information. 1uptick.com should not be regarded as soliciting any subscriber or visitor to execute any trade. You are solely responsible for all of your own trading decisions.