


 |
| Gold V.1.3.1 signal Telegram Channel (English) |
AUDUSD Technical Analysis: Key Support Tested Amid Heightened Market Risk Sentiment
2026-04-08 @ 06:01
Over the past 24 to 48 hours, the AUD/USD pair has experienced increased volatility, closing yesterday near 0.6976. Heightened geopolitical tensions in the Middle East, notably Iran’s rejection of a ceasefire proposal, have intensified market uncertainty, limiting risk appetite and weighing on the Australian dollar. Concurrently, ongoing US interest rate hikes have strengthened the US dollar, further restraining AUD gains.
Although risk appetite briefly improved, lifting AUD/USD towards the 0.6920 level, persistent geopolitical risks prevented sustained advances. This resembles investors hitting the pause button amid complex international developments to wait for clearer direction.
For the average investor, this signals markets remain highly sensitive to risk events: even positive short-term drivers can be quickly offset by global economic and political uncertainties influencing currency movements. Strategically, this underscores the importance of careful position management and close monitoring of major global events impacting the US dollar’s strength.

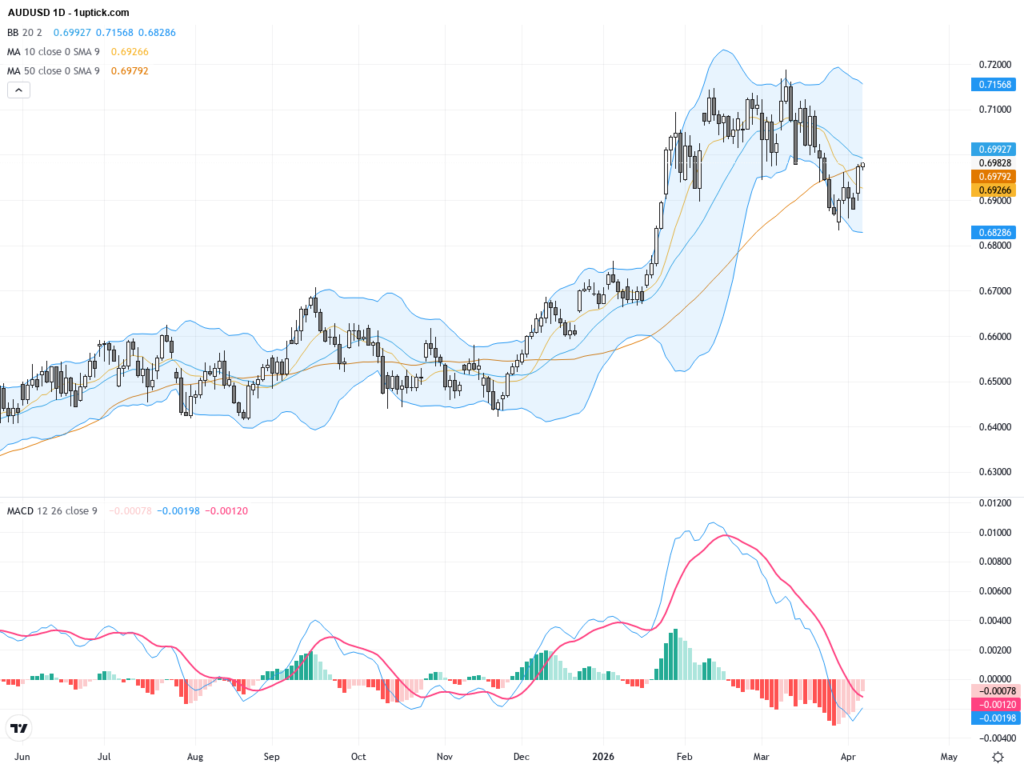
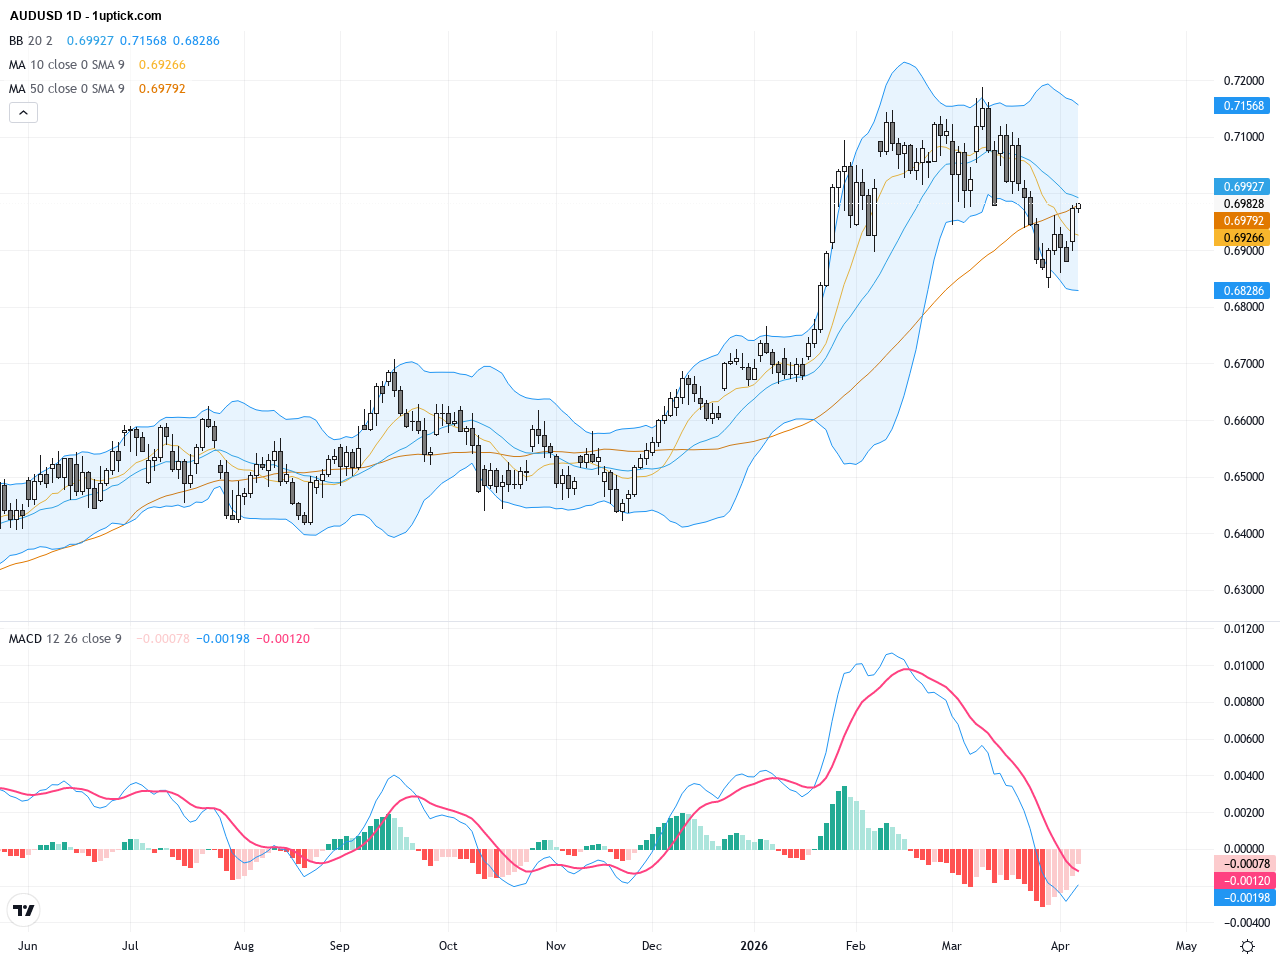
The daily chart illustrates a clear downtrend since AUDUSD peaked near 0.7123. Prices now trade below the 21-day moving average, reflecting prevailing selling pressure. Bollinger Bands have contracted, indicating reduced volatility, and the MACD is showing bearish momentum with recent negative crossovers. The overall daily trend remains cautiously bearish with no signs yet of a reversal.
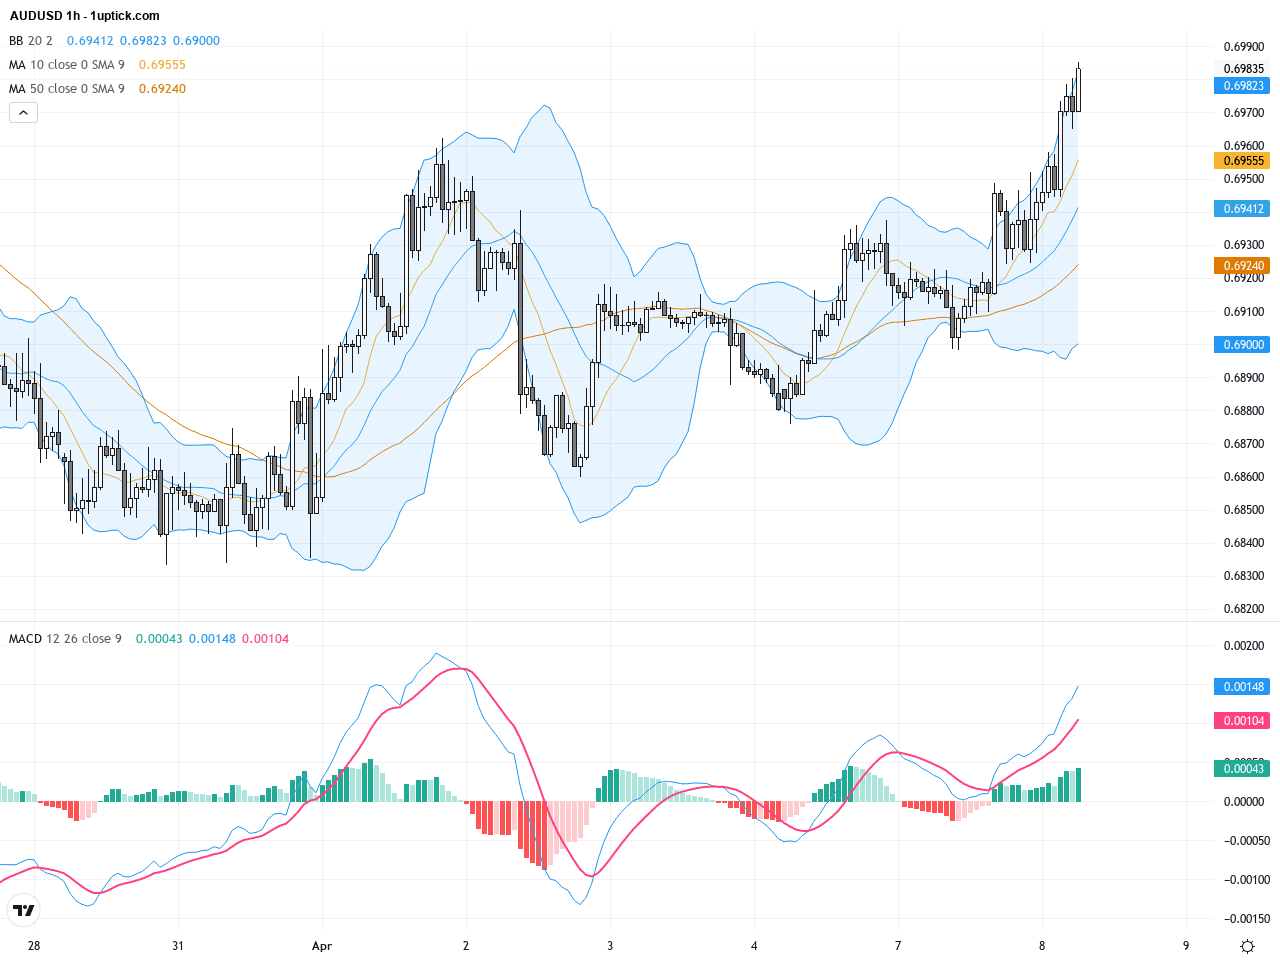
On the hourly chart examining the past 3-5 days, AUDUSD has been confined within a tight range between 0.6950 and 0.6980, evidencing sideways consolidation. Moving averages frequently cross without forming a directional bias. Bollinger Bands place price near the median band, and MACD suggests momentum is neutral. Multiple Doji candles with long shadows indicate indecision between buyers and sellers, signaling no immediate clear trade bias.
Technical Trend: Cautiously bearish with sideways consolidation
Technically, AUDUSD remains under bearish control on the daily chart with volume confirming ongoing selling pressure and MACD aligned with a negative trend. The critical support at 0.6835 must hold to avoid accelerated downside momentum. The hourly chart reflects consolidation, marked by indecision candles and neutral momentum indicators, highlighting market uncertainty. Traders should watch the upcoming FOMC minutes and Middle East developments closely for cues on the next directional move.Today’s economic calendar in GMT+1 shows no major Australian events scheduled. The Reserve Bank of New Zealand holds its official cash rate steady at 2.25%, unlikely to impact AUDUSD directly. Key attention will be on the later US FOMC minutes release, potentially influencing USD strength and thus indirectly affecting AUDUSD. Overall, no immediate direct economic drivers for AUDUSD are expected today.
Resistance & Support

The above financial market data, quotes, charts, statistics, exchange rates, news, research, analysis, buy or sell ratings, financial education, and other information are for reference only. Before making any trades based on this information, you should consult independent professional advice to verify pricing data or obtain more detailed market information. 1uptick.com should not be regarded as soliciting any subscriber or visitor to execute any trade. You are solely responsible for all of your own trading decisions.