


 |
| Gold V.1.3.1 signal Telegram Channel (English) |

AUDUSD Technical Outlook: Key Support at 0.6830 in Focus Amid Strong US Dollar
2026-04-03 @ 06:01
Over the past 24 to 48 hours, the AUD/USD pair exhibited notable volatility, closing yesterday at 0.69071, down approximately 0.3% from the previous day. The market was influenced by significant news, with a strong US dollar rally playing a key role in shaping the Australian dollar’s movement.
Specifically, the US dollar surged following statements from former President Trump that unsettled the markets, amplifying risk-off sentiment and driving investors towards the safety of the greenback, thereby pressuring AUD/USD lower. Additionally, heightened geopolitical tensions in the Middle East and soaring oil prices added uncertainty, prompting cautious capital flows.
In simple terms for the average investor, the recent weakening of the Australian dollar reflects increased global uncertainty and US dollar strength. This emphasizes that significant events can lead to increased market swings. Keeping an eye on upcoming US policy moves and geopolitical developments is essential for anticipating the direction of AUD/USD.
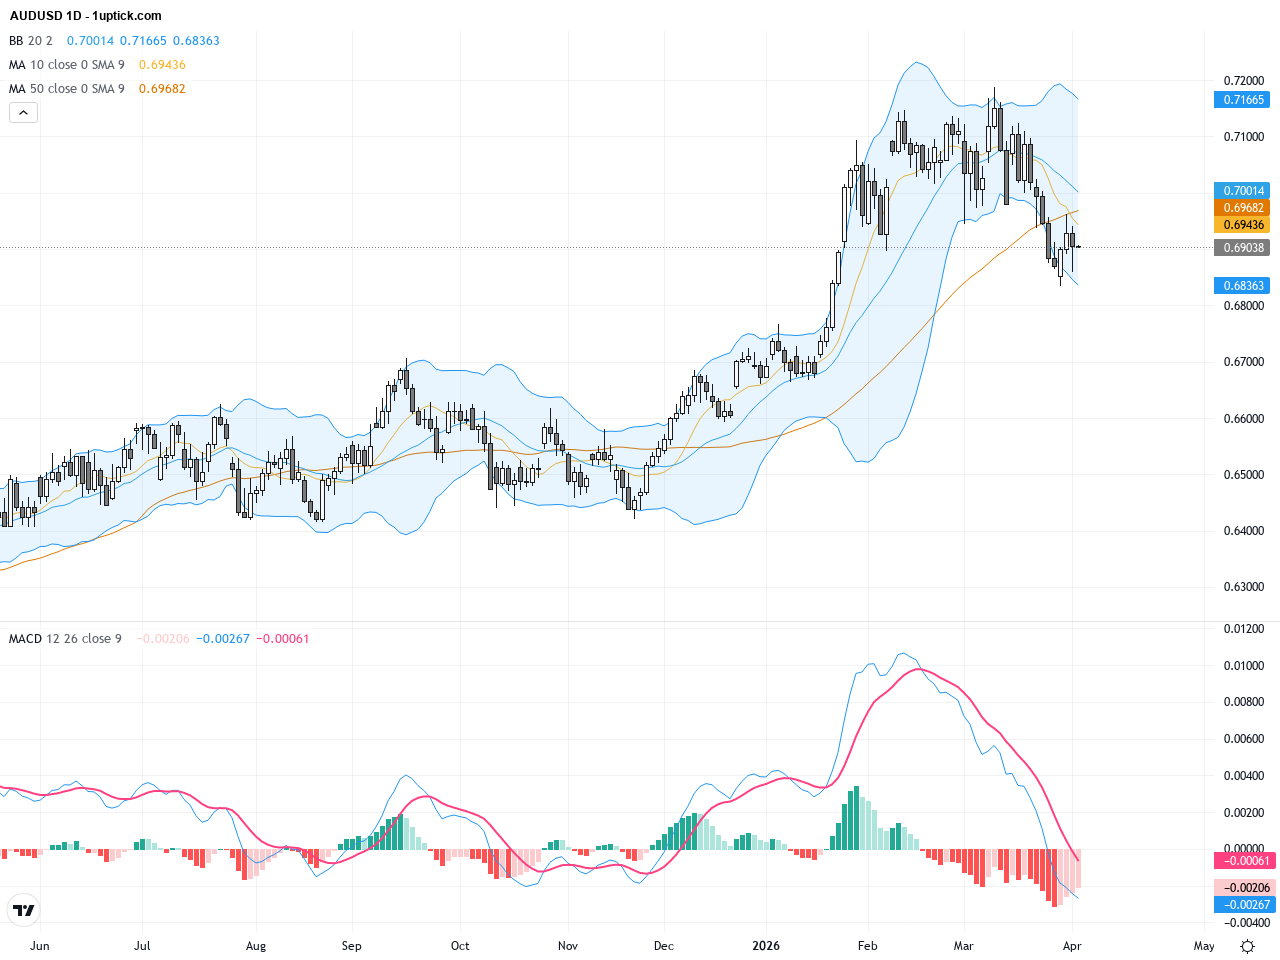
The daily chart of AUDUSD shows a clear downtrend from the year’s peak near 0.718. Price action has been oscillating around the 0.6910 region recently, with the 50-day moving average near 0.703 and the 200-day near 0.671, showing a convergence that signals no clear reversal yet. Bollinger Bands are narrowing, indicating reduced volatility and a potential upcoming breakout. The MACD histogram is shrinking in the negative, suggesting potential for a bounce, but the overall bias remains bearish. From a technical perspective, the pair maintains a long-term downtrend and needs a break above 0.6910 resistance to signal a meaningful recovery.
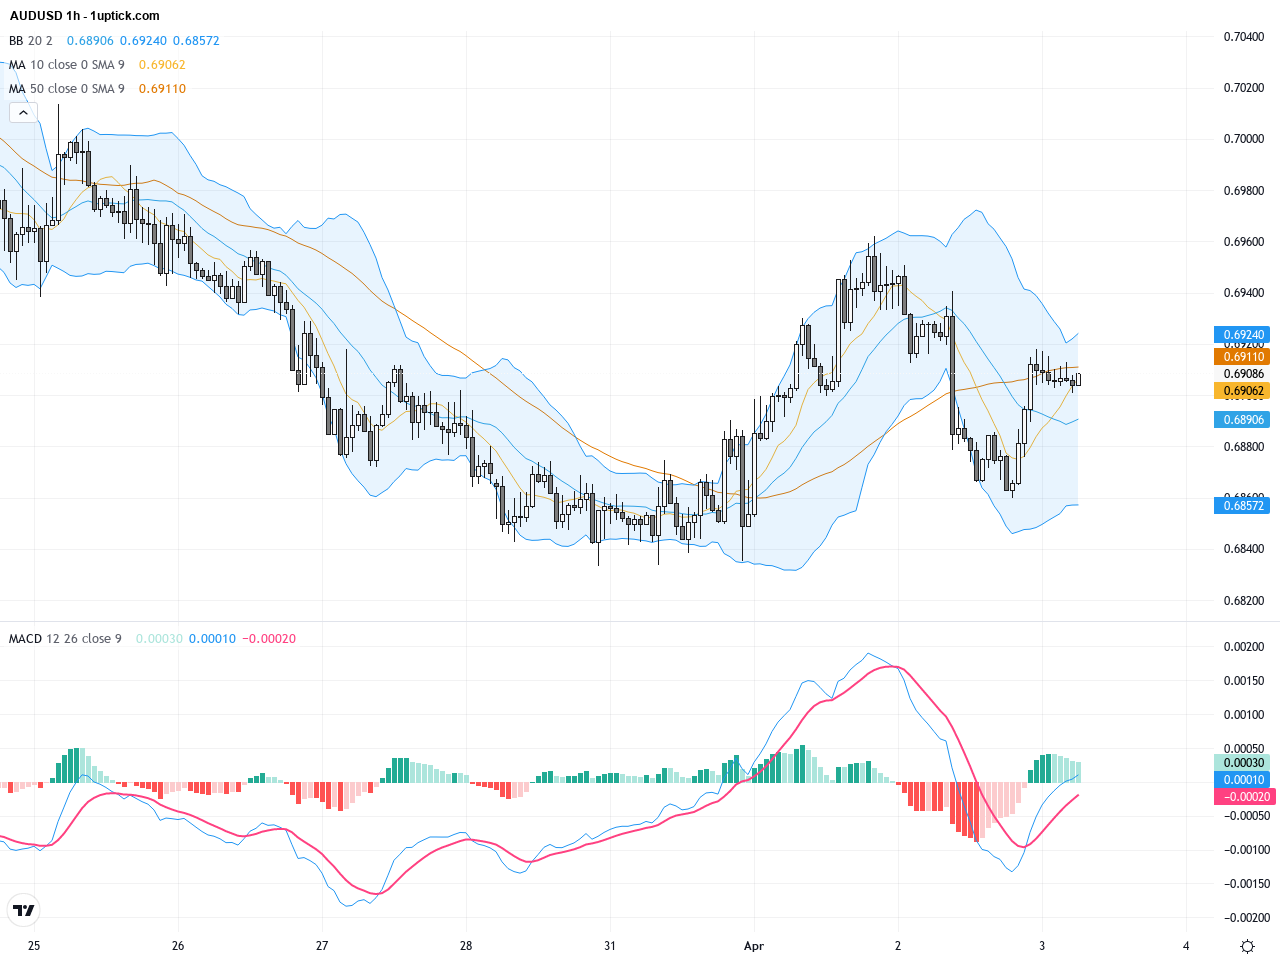
On the hourly chart, AUDUSD has been trending downward over the past 3 to 5 days from about 0.694 to lows around 0.686. Bollinger Bands are expanding, reflecting increased volatility. The 20-period moving average has crossed below the 50-period MA (a bearish crossover), and MACD fast line is below the slow line, all indicating short-term bearish momentum. However, a recent hammer candlestick with a long lower wick suggests the selling pressure may be ebbing, hinting at a possible rebound within the next 24 hours if 0.690 resistance is cleared. Otherwise, the short-term downtrend likely persists.
Technical Trend: The current AUDUSD trend is cautiously bearish with heightened volatility as price consolidates between key support and resistance levels awaiting a directional breakout.
Technically, the recent hammer candlestick on the hourly chart signals waning bearish pressure, hinting at a potential short-term rally in AUDUSD. The MACD negative histogram contraction confirms weakening selling momentum. If the pair holds support at 0.6830 and breaks above 0.690 resistance decisively, a rebound may ensue. Volume remains steady but deserves attention going forward to confirm the momentum shift. Traders should remain vigilant around the US labor data release, which could trigger volatile moves and present high-probability trading opportunities.Today’s economic calendar in GMT+1 includes key US labor market releases at 14:30 local time, such as Unemployment Rate, Non-Farm Employment Change, and Average Hourly Earnings—data sets crucial for AUDUSD price action. Stronger-than-expected US employment figures would likely boost the US dollar further, placing downward pressure on AUDUSD. Conversely, weaker data might provide relief for the Australian dollar. Other scheduled releases from China, France, and Turkey are less directly relevant to AUDUSD today. For traders in Hong Kong (HKT), the US data will arrive at 22:30 local time, making it a crucial event to watch.
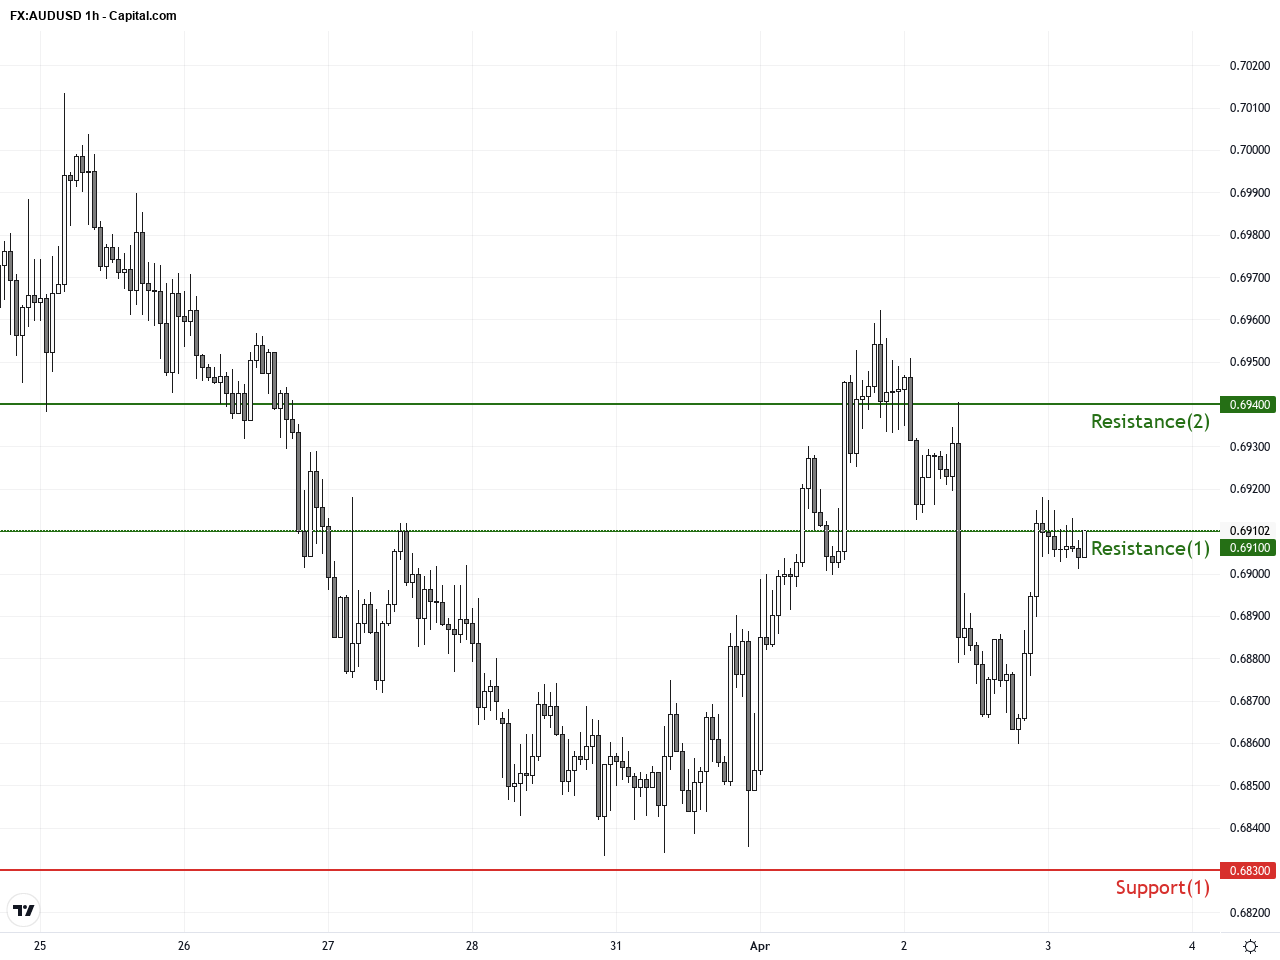
Resistance & Support
The above financial market data, quotes, charts, statistics, exchange rates, news, research, analysis, buy or sell ratings, financial education, and other information are for reference only. Before making any trades based on this information, you should consult independent professional advice to verify pricing data or obtain more detailed market information. 1uptick.com should not be regarded as soliciting any subscriber or visitor to execute any trade. You are solely responsible for all of your own trading decisions.