


 |
| Gold V.1.3.1 signal Telegram Channel (English) |

GBPUSD Breaks Key 1.34 Resistance – Bull Flag Technical Pattern Signals Trading Upside
2026-04-08 @ 13:02
Over the past 24 to 48 hours, GBP/USD has shown strong bullish momentum, rallying from yesterday’s closing price of 1.32886 to trade near the 1.3400 level, marking a third consecutive day of gains. This upward surge was driven primarily by improved US-Iran ceasefire talks, which boosted market risk sentiment and pressured the US dollar, benefiting the British pound notably. Investors have grown more willing to enter the market amid easing tensions in the Middle East, pushing the pound higher.
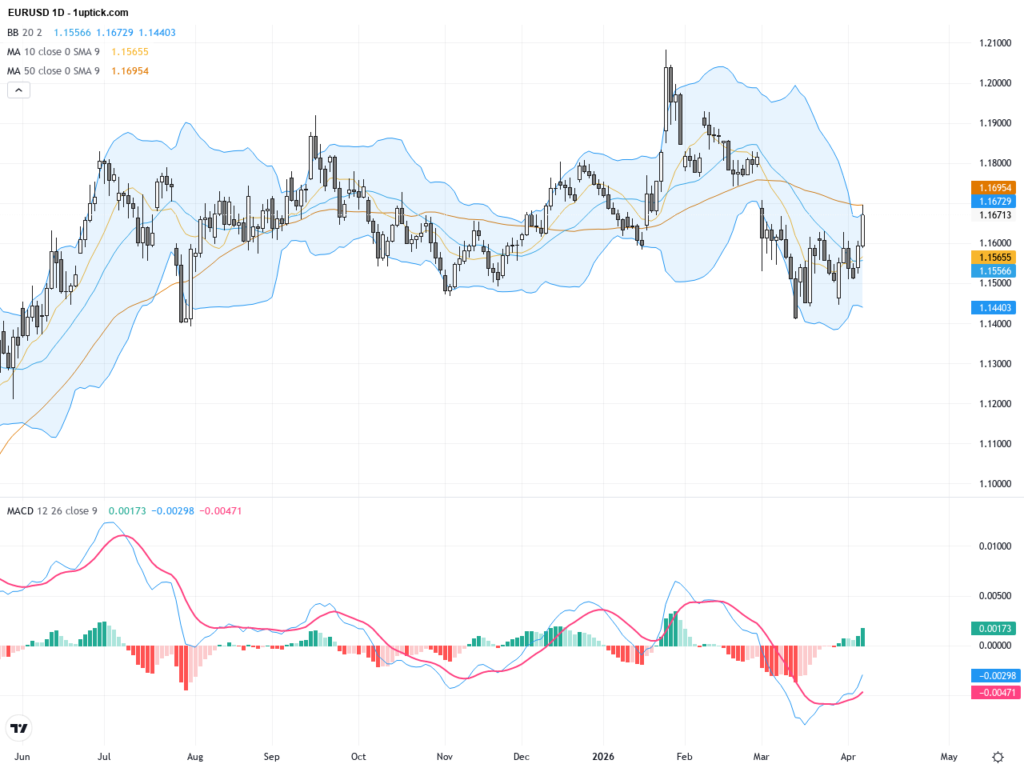
From a broader perspective, positive progress in US-Iran peace negotiations intensified bullish market sentiment, causing the US Dollar Index (DXY) to stall near the critical resistance of 100.50. This scenario paves the way for potential breakouts in pairs like GBP/USD and EUR/USD. While UK economic data revealed near-stagnant growth for Q4, which has raised some concerns about increasing selling pressure on the pound, the immediate market tone has been clearly encouraged by geopolitical relaxation.
In simpler terms for the average investor, the recent performance of GBP/USD resembles a situation where improving global geopolitical conditions encourage capital flows away from the safe-haven US dollar toward riskier assets like the pound. This has generated significant short-term buying appetite. Nonetheless, given the weak underlying UK economic growth, this rally faces ups and downs, and any renewed Middle East tensions could quickly reverse gains for the pound.

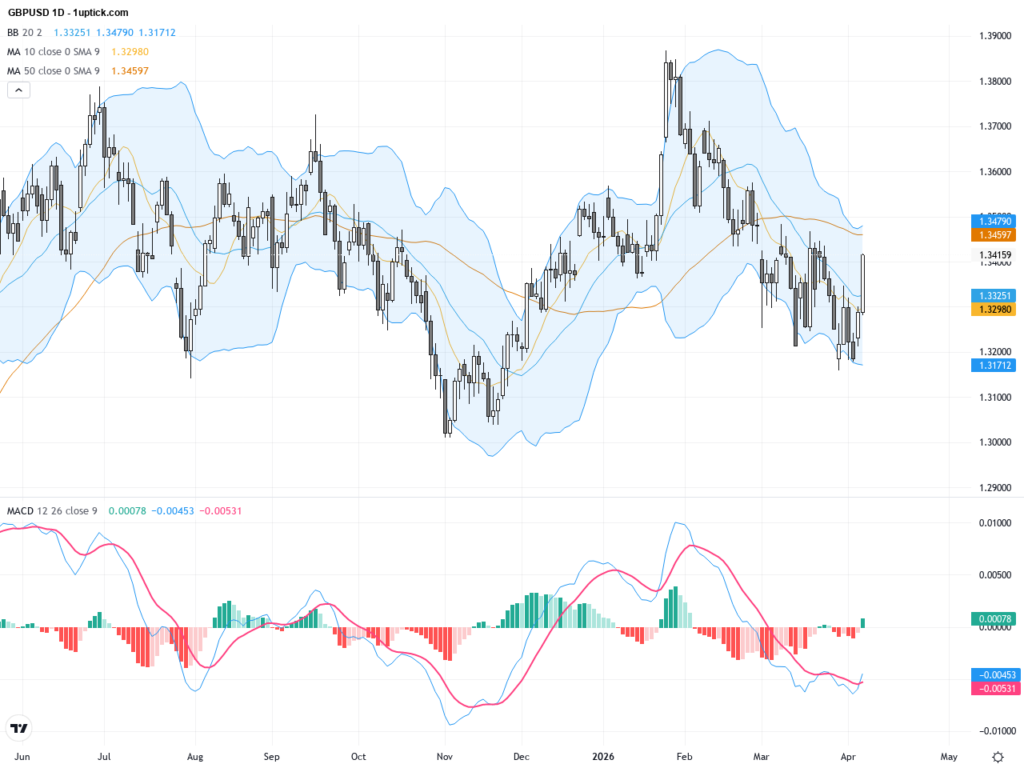
Daily chart displays a steady uptrend for GBPUSD. The price remains comfortably above both the 50-day and 200-day moving averages, which are aligned bullishly. Bollinger Bands widen upwards indicating expanding volatility with strong bullish momentum. The MACD indicator stays above zero with a continued bullish crossover between the MACD and signal lines. A clear bull flag pattern has formed, suggesting consolidation before a potential breakout continuation in the upward direction.

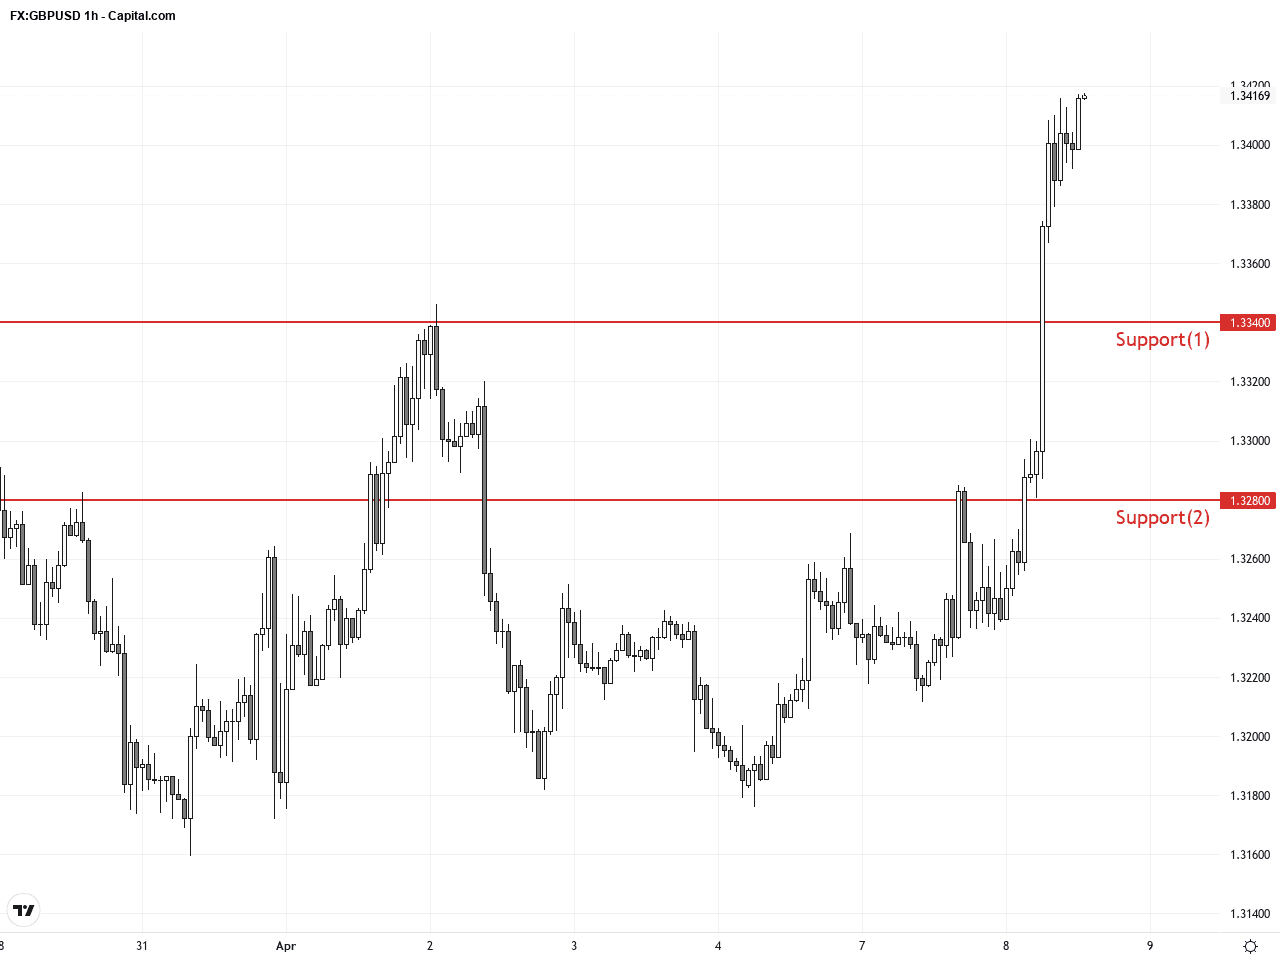
The hourly chart over the past 3-5 days shows clear breakout buying, especially during Asian trading hours where the pair surpassed the 1.34 level. Price pulled back slightly to confirm support and then quickly rebounded. The middle Bollinger Band acted as a support line, while MACD histograms expanded, confirming momentum strength. A recent bullish engulfing candlestick signals a positive outlook for the next 24 hours. Short-term technicals favor further upside continuation.
Technical Trend: GBPUSD is in a decisively bullish trend with active medium and short-term buying interest. Breaking out of the bull flag pattern could pave the way for further gains.
The standout technical signal for GBPUSD is the bull flag pattern forming on the daily chart, indicating a healthy consolidation before a likely breakout. On the hourly chart, bullish engulfing candles and strong moving average support confirm short-term buying strength. MACD momentum remains intact with supportive volume trends that hint at higher probability trades on the long side. Traders should monitor the 1.34-1.3450 area for breakout confirmation or downside pullback entry opportunities.Today’s economic calendar shows limited direct data impacting GBPUSD. The UK Halifax house price index for March is expected to show a slight increase of 0.1% month-over-month, offering mild support. Key to watch are later US events such as the FOMC minutes and speeches; dovish or hawkish tones there could sway the USD, and indirectly influence GBPUSD price action. Overall, no major UK or US data directly impacting GBPUSD trade is scheduled, so geopolitical and risk sentiment remain dominant factors.
Resistance & Support
The above financial market data, quotes, charts, statistics, exchange rates, news, research, analysis, buy or sell ratings, financial education, and other information are for reference only. Before making any trades based on this information, you should consult independent professional advice to verify pricing data or obtain more detailed market information. 1uptick.com should not be regarded as soliciting any subscriber or visitor to execute any trade. You are solely responsible for all of your own trading decisions.