


 |
| Gold V.1.3.1 signal Telegram Channel (English) |
How to Build DCF Valuation Models for Mine-Site Precious Metals Assets Using NPV, IRR, and Metal Price Sensitivity Scenarios Amid 2026 Supply Constraints
2026-04-10 @ 00:06
Building DCF Valuation Models for Precious Metals Mining Assets: A Strategic Framework for 2026 Supply Constraints
In an era of heightened market volatility and anticipated supply constraints in the precious metals sector, mastering discounted cash flow (DCF) valuation techniques has become essential for sophisticated investors and mining analysts. This comprehensive guide provides a systematic approach to building robust valuation models that account for the unique characteristics of mine-site assets while incorporating forward-looking supply-demand dynamics expected to materialize in 2026.
The precious metals mining sector faces unprecedented challenges, including declining ore grades, geopolitical uncertainties, and ESG-related capital constraints. These factors are projected to create significant supply bottlenecks by 2026, making accurate asset valuation more critical than ever for investment decision-making.
step_num: 1, heading: Establish the Geological and Operational Foundation
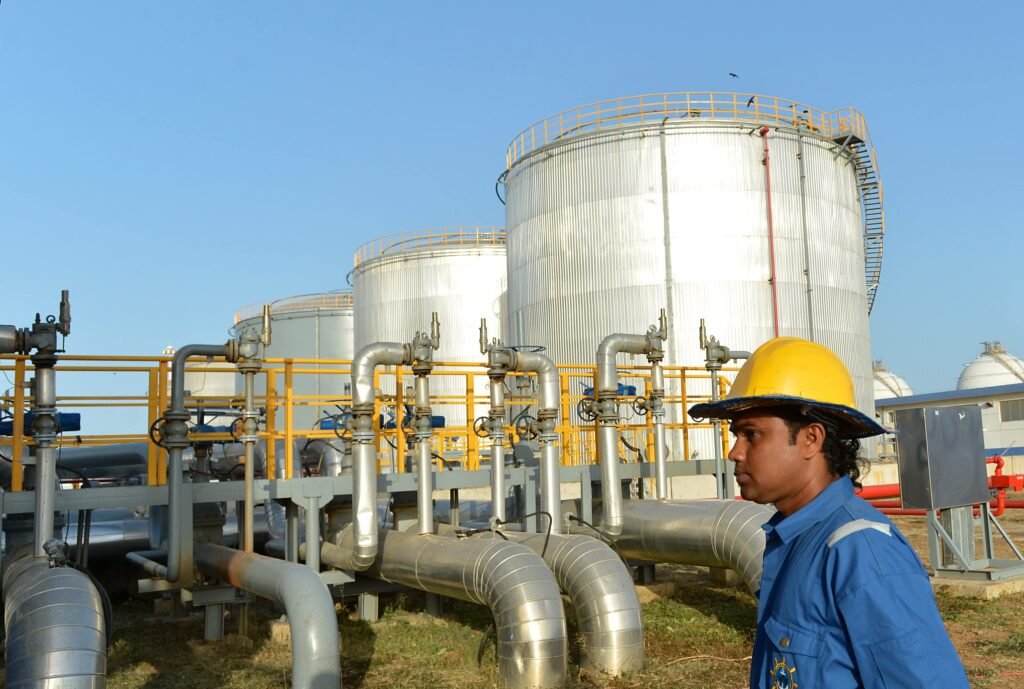
Begin by gathering comprehensive technical data from NI 43-101 compliant reports or JORC-standard resource estimates. Document proven and probable reserves, measured and indicated resources, and inferred resources separately. Calculate the mine life based on annual throughput capacity and total recoverable ounces. Include metallurgical recovery rates, strip ratios for open-pit operations, and dilution factors. This geological foundation directly impacts your cash flow projections and risk assessment. For 2026 supply constraint modeling, pay particular attention to development-stage projects that may face permitting delays or capital access limitations.
step_num: 2, heading: Develop Production and Revenue Projections
Create a year-by-year production schedule aligned with the mine plan, accounting for ramp-up periods, steady-state production, and decline phases. Apply realistic metallurgical recovery rates (typically 85-95% for gold, 75-90% for silver) to convert ore grades to recoverable metal. Structure revenue calculations using the formula: Revenue = Production Ounces × Metal Price × (1 – Royalty Rate). Incorporate streaming and royalty obligations that are prevalent in the sector. For multi-metal deposits, establish by-product credit assumptions based on historical price correlations.
step_num: 3, heading: Model Operating and Capital Expenditure Structures
Construct detailed cost models using industry-standard metrics including All-In Sustaining Costs (AISC) and All-In Costs (AIC). Break down operating expenses into mining costs (per tonne moved), processing costs (per tonne milled), and G&A expenses. Model sustaining capital requirements for equipment replacement, tailings management, and resource conversion drilling. For development projects, include initial capital expenditure with contingency factors of 15-25%. Account for inflationary pressures on labor, energy, and consumables that may intensify amid 2026 supply constraints.
step_num: 4, heading: Incorporate Tax, Royalty, and Working Capital Dynamics
Map the jurisdiction-specific fiscal regime including corporate income tax rates, mining-specific taxes, and royalty structures (NSR, NPI, or ad valorem). Model tax depreciation schedules using applicable methods (declining balance, units of production). Include loss carry-forward provisions where applicable. Calculate working capital requirements based on inventory holding periods, receivables cycles, and payables terms. For precious metals operations, typically model 30-45 days of inventory, 15-30 days receivables, and 30-45 days payables.
step_num: 5, heading: Calculate Unlevered Free Cash Flows
Derive annual unlevered free cash flows using the formula: UFCF = EBIT × (1 – Tax Rate) + Depreciation & Amortization – Capital Expenditures – Changes in Working Capital. Present cash flows in real terms (constant dollars) or nominal terms, maintaining consistency with your discount rate approach. For mine-site valuations, it is standard practice to use real cash flows and real discount rates to avoid compounding inflation assumptions. Create separate cash flow streams for each metal if conducting sum-of-parts analysis.
step_num: 6, heading: Determine Appropriate Discount Rates
Select discount rates reflecting project-specific risk profiles. For precious metals mining assets, typical real discount rates range from 5-8% for producing assets in stable jurisdictions, 8-12% for development projects, and 12-15%+ for exploration or high-risk jurisdictions. Build discount rates from first principles using CAPM: Required Return = Risk-Free Rate + Beta × Equity Risk Premium + Country Risk Premium + Project-Specific Premium. Consider that 2026 supply constraints may reduce systematic risk for established producers while increasing development risk for new projects.
step_num: 7, heading: Compute NPV and IRR Metrics
Calculate Net Present Value by discounting all future cash flows to present value and summing: NPV = Σ [CFt / (1 + r)^t] – Initial Investment. Compute Internal Rate of Return as the discount rate that yields NPV = 0, using iterative methods or financial functions. For mining projects, also calculate payback period and NPV-to-CapEx ratio (target >1.0x for investment consideration). Generate NPV profiles showing value sensitivity across discount rate ranges. IRR hurdle rates for precious metals projects typically range from 15-25% depending on risk profile.
step_num: 8, heading: Build Metal Price Sensitivity Scenarios for 2026 Supply Constraints
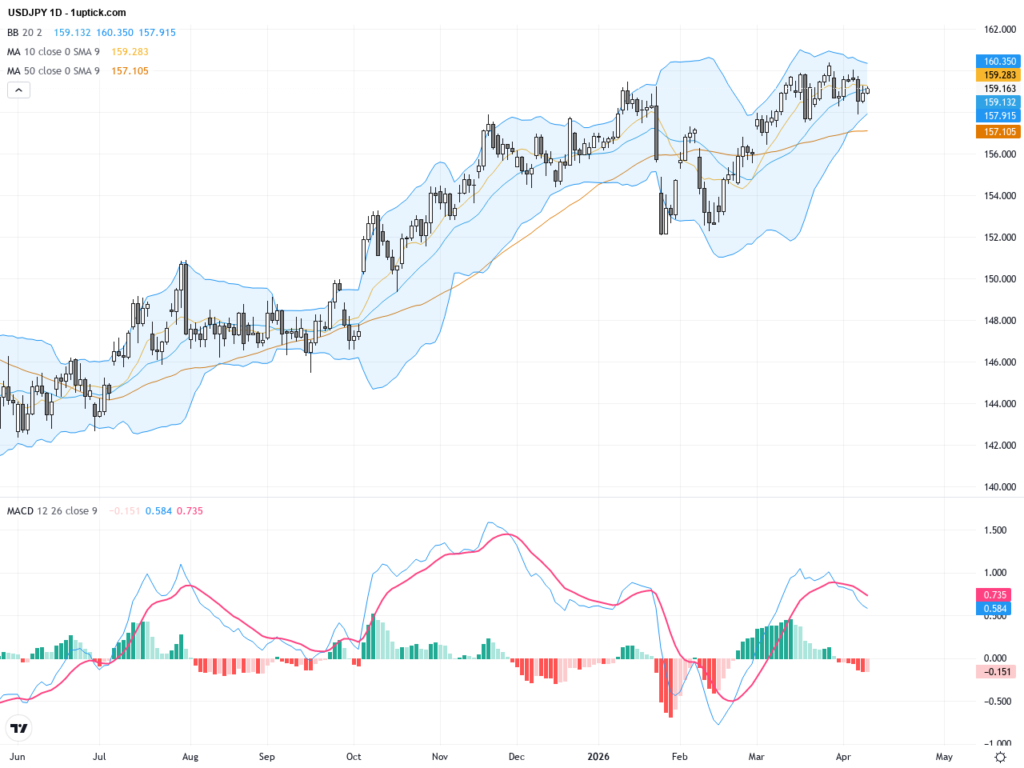
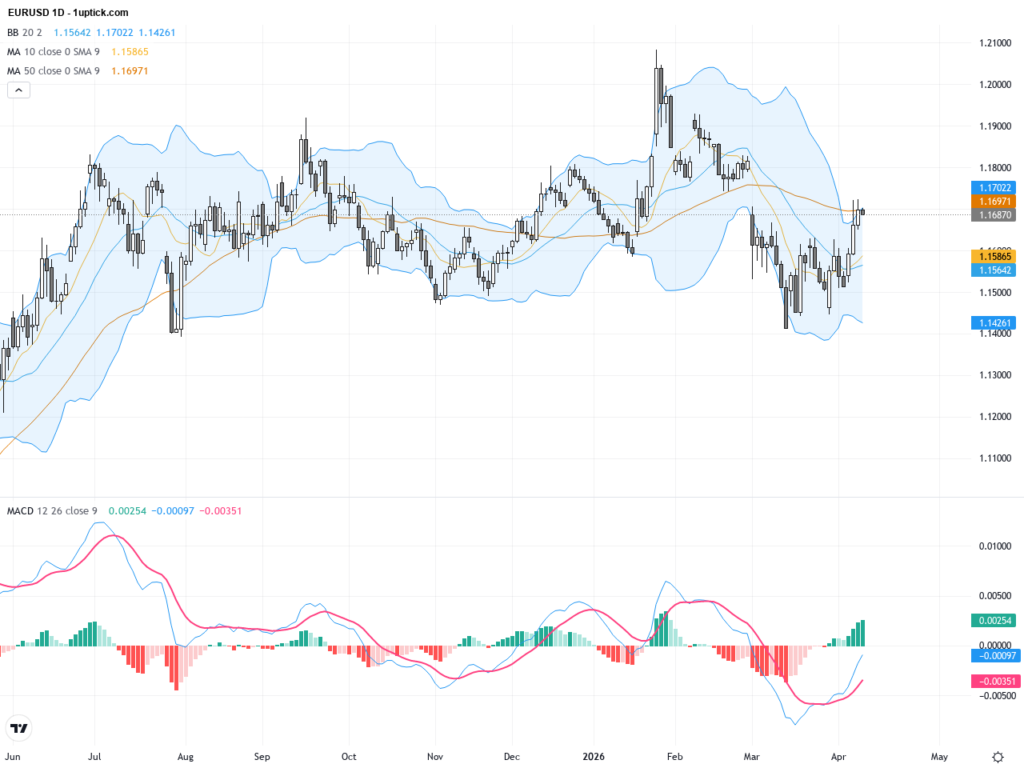
Develop three to five metal price scenarios reflecting potential 2026 supply constraint outcomes. Base Case: Use consensus forecasts or forward curve prices. Bull Case: Model 20-40% price appreciation reflecting supply shortfalls from delayed projects, resource nationalism, and ESG capital constraints. Bear Case: Assume 15-25% price decline from demand destruction or unexpected supply additions. Stress Case: Test project viability at marginal production costs ($1,200-1,400/oz gold). Create dynamic sensitivity tables showing NPV and IRR across price scenarios combined with discount rate variations.
step_num: 9, heading: Conduct Monte Carlo Simulation for Risk Quantification
Implement probabilistic analysis by assigning probability distributions to key variables: metal prices (log-normal), grades (normal with defined variance), operating costs (triangular), and capital costs (right-skewed triangular reflecting typical overruns). Run 10,000+ iterations to generate NPV probability distributions. Report P10, P50, and P90 outcomes to characterize downside risk and upside potential. This approach is particularly valuable amid supply uncertainty as it quantifies the probability-weighted value impact of various 2026 scenarios.
step_num: 10, heading: Integrate Optionality and Strategic Value
Recognize that standard DCF may undervalue mining assets by ignoring embedded real options. Model expansion options if resources extend beyond current mine plans. Value deferral options for marginal projects that become viable under higher prices. Consider abandonment options that limit downside. For advanced analysis, apply Black-Scholes or binomial option pricing to quantify strategic flexibility. In a 2026 supply-constrained environment, optionality premiums may be particularly significant for development-stage assets.
step_num: 11, heading: Validate and Stress-Test Your Model
Perform rigorous model validation including: balance checks ensuring assets equal liabilities plus equity; cash flow reconciliation to ensure consistency between statements; comparison of unit costs to peer benchmarks and company guidance; verification that terminal values do not exceed remaining reserves; and cross-checking multiples implied by your DCF against trading comparables. Document all assumptions with clear sources and reasoning. Establish version control protocols for model updates.
Insider Insight: Experienced precious metals analysts recognize that DCF models are only as reliable as their underlying assumptions. In the current market environment, the most sophisticated institutional investors are placing increased emphasis on two factors: jurisdiction quality and management execution track record. With 2026 supply constraints expected to intensify competition for development capital, assets in mining-friendly jurisdictions (Nevada, Western Australia, parts of West Africa) commanded premiums of 0.5-1.0x NAV in recent M&A transactions. Additionally, consider building optionality into your models for potential M&A scenarios—many mid-tier producers will likely pursue aggressive consolidation strategies to secure future production profiles. The most robust valuation approach combines bottom-up DCF with market-derived trading multiples (EV/Resource, P/NAV) and precedent transaction analysis to triangulate fair value ranges rather than point estimates.