


 |
| Gold V.1.3.1 signal Telegram Channel (English) |

USDCAD Technical Breakout and Fundamental Analysis: Key Levels to Watch Now
2026-04-07 @ 13:01
Over the past 48 hours, USD/CAD has experienced notable volatility, closing yesterday at 1.39175 with a slight increase from previous levels. Market attention has been fixated on developments in US-Iran relations, particularly reports of a circulating ceasefire plan that offered investors some relief.
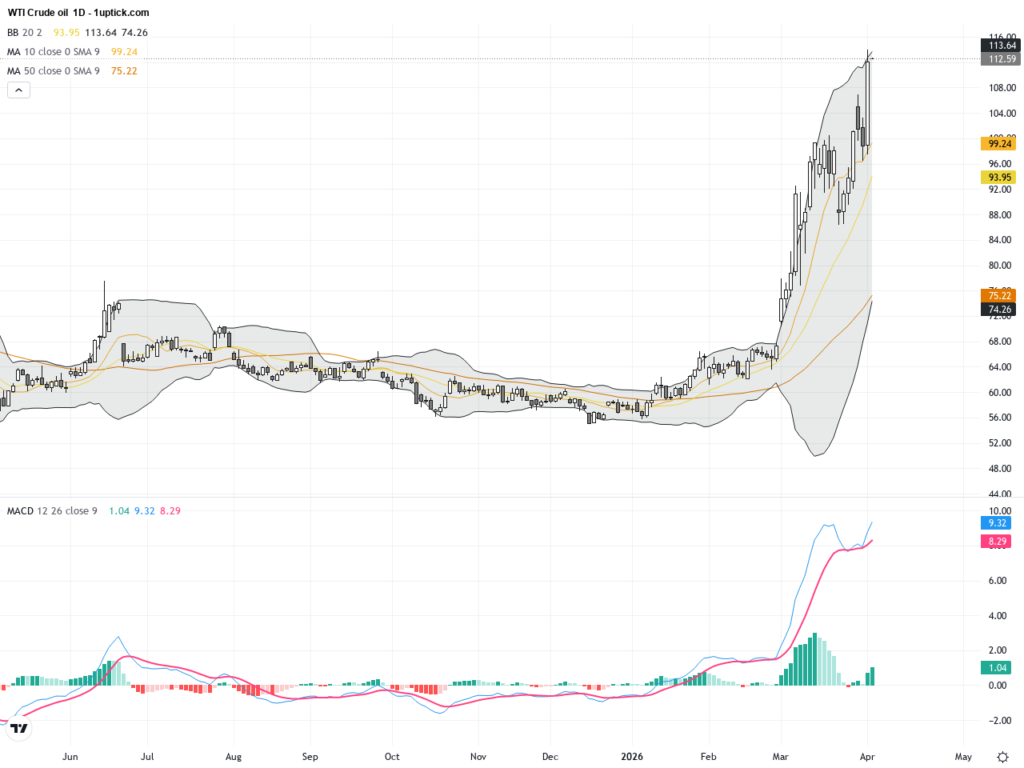
Despite some rebound in the US dollar amid easing Middle East tensions, the dollar remains under structural weakness pressure, especially as demand for safe-haven assets fades. Reuters reported the expiration of Trump’s 48-hour deadline has left the market cautiously eyeing potential de-escalation. This contributed to the dollar’s decline, while the Canadian dollar was buoyed by strong energy prices, given Canada’s key role as an energy exporter.
For the average investor, these currency movements can be understood as a direct impact of unfolding geopolitical events. When diplomatic breakthroughs emerge, risk sentiment lifts, reducing demand for the dollar as a safe haven. Capital flows shift into the loonie and other commodity-linked currencies, visibly driving the USD/CAD swing observed recently.

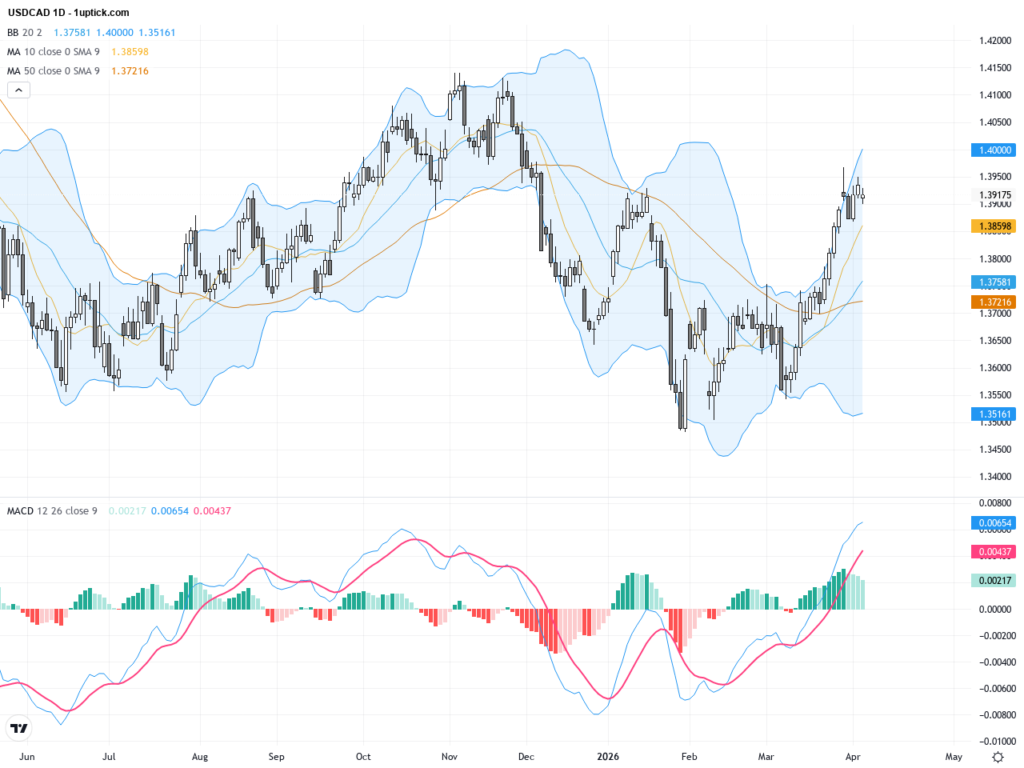
On the daily chart, USDCAD shows a consolidating uptrend, rising from around 1.35 since early this year to close near 1.39. The 50-day moving average sits above the 200-day, indicating a bullish medium to long-term trend. However, repeated tests of the 1.393-1.395 resistance zone have yet to break higher, hinting at a possible head and shoulders pattern formation that signals short-term correction risk. Bollinger Bands indicate the price is near the upper band, increasing volatility, while MACD momentum is positive but showing signs of weakening.
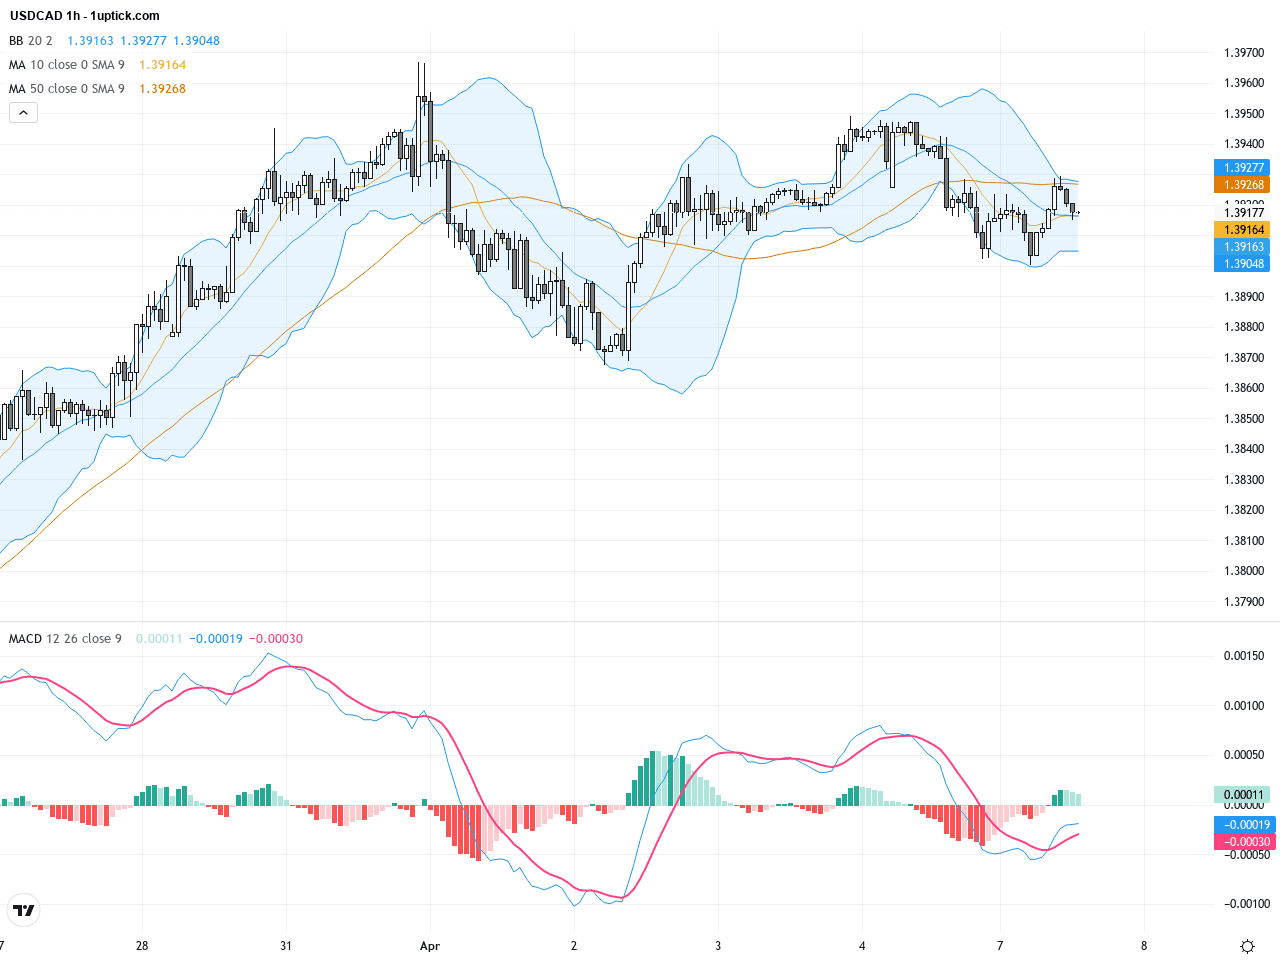
The hourly chart displays 3-5 days of sideways consolidation with notable swings between 1.388 and 1.392. A small flag pattern has been forming, showing potential for a breakout. The MACD recently gave a minor bullish crossover, signaling short-term momentum pickup. RSI remains in healthy bullish territory around 55-65 but close to overbought levels, suggesting some risk of pullback in the near term. Overall, the short-term price action is range-bound, awaiting a decisive move.
Technical Trend: The current USDCAD trend is cautiously bullish with signs of consolidation and increased volatility, awaiting a clear breakout for directional confirmation.
Technically, USDCAD remains in a bullish daily trend, but the potential head and shoulders pattern needs close monitoring for signs of a pullback. The hourly flag pattern combined with a bullish MACD crossover indicates a potential near-term upside breakout, yet RSI nearing overbought warns of momentum fatigue. The upcoming Canadian Ivey PMI release is a crucial fundamental catalyst that could shift market sentiment quickly. Traders should keep a close eye on this data and ongoing geopolitical developments to carefully position in USDCAD.Today’s GMT+1 economic calendar shows Canada’s Ivey Purchasing Managers Index scheduled for release at 23:00 HKT, with a forecast of 57.2 up from 56.6 previously. A stronger-than-expected reading would support the Canadian dollar and likely push USDCAD lower. Earlier data like Japan’s household spending may influence overall risk sentiment but has limited direct impact on USDCAD. No major US economic releases are expected today, so the focus remains on geopolitical news and Canada’s energy market fundamentals.
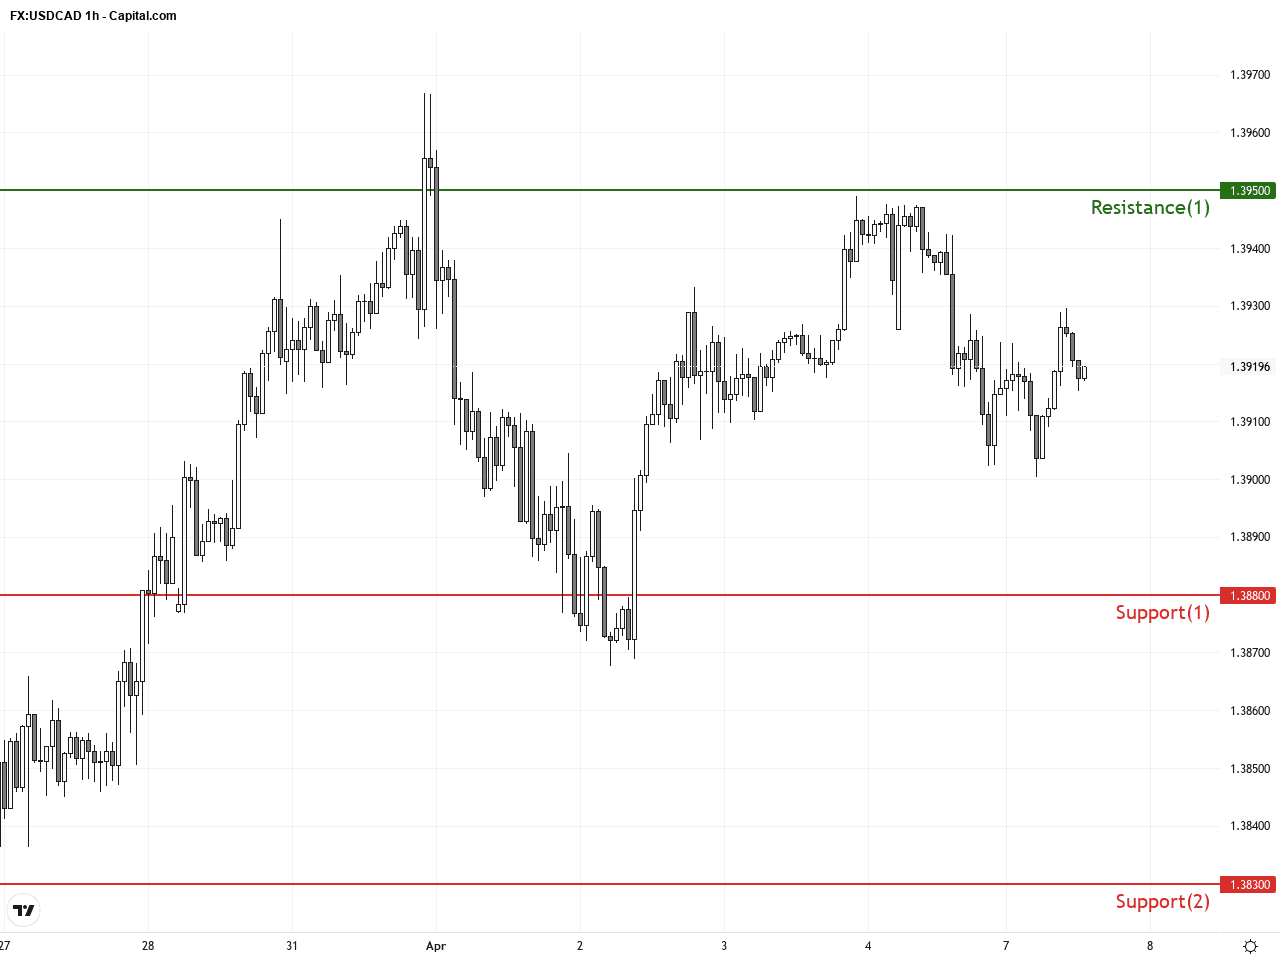
Resistance & Support
The above financial market data, quotes, charts, statistics, exchange rates, news, research, analysis, buy or sell ratings, financial education, and other information are for reference only. Before making any trades based on this information, you should consult independent professional advice to verify pricing data or obtain more detailed market information. 1uptick.com should not be regarded as soliciting any subscriber or visitor to execute any trade. You are solely responsible for all of your own trading decisions.