


 |
| Gold V.1.3.1 signal Telegram Channel (English) |

USDCAD: Watching a Critical Break Above 1.3730 as Technical and Fundamental Trends Align
2026-04-09 @ 13:01
In the past 24 to 48 hours, the USD/CAD exchange rate displayed noticeable volatility, fluctuating slightly around yesterday’s closing price of 1.38494. Market sentiment was significantly influenced by the latest geopolitical developments, particularly news of a possible ceasefire agreement between the US and Iran.
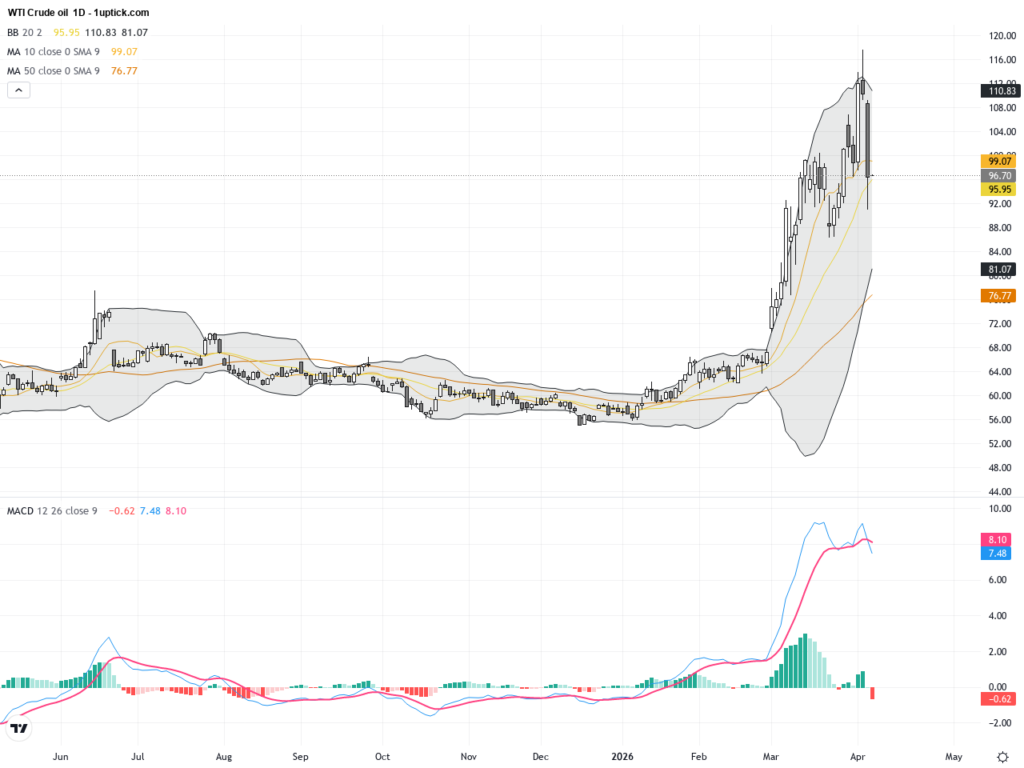
This news eased safe-haven demand, strengthening the Canadian dollar and putting pressure on the US dollar. Coupled with a decline in oil prices, the Canadian currency, as a major energy exporter, found support while the USD/CAD pair edged closer to the mid-1.38 range. Compared to yesterday’s closing rate, the pair remained near lows, reflecting market caution as traders await clearer details on the ceasefire.
For the average investor, the recent USD/CAD movement is primarily driven by easing geopolitical tensions and volatility in oil prices, which directly affect the energy-sensitive Canadian dollar. Investors may notice increased exchange rate fluctuations triggered by these political developments, presenting both challenges and short-term trading opportunities amid the ongoing uncertainty.

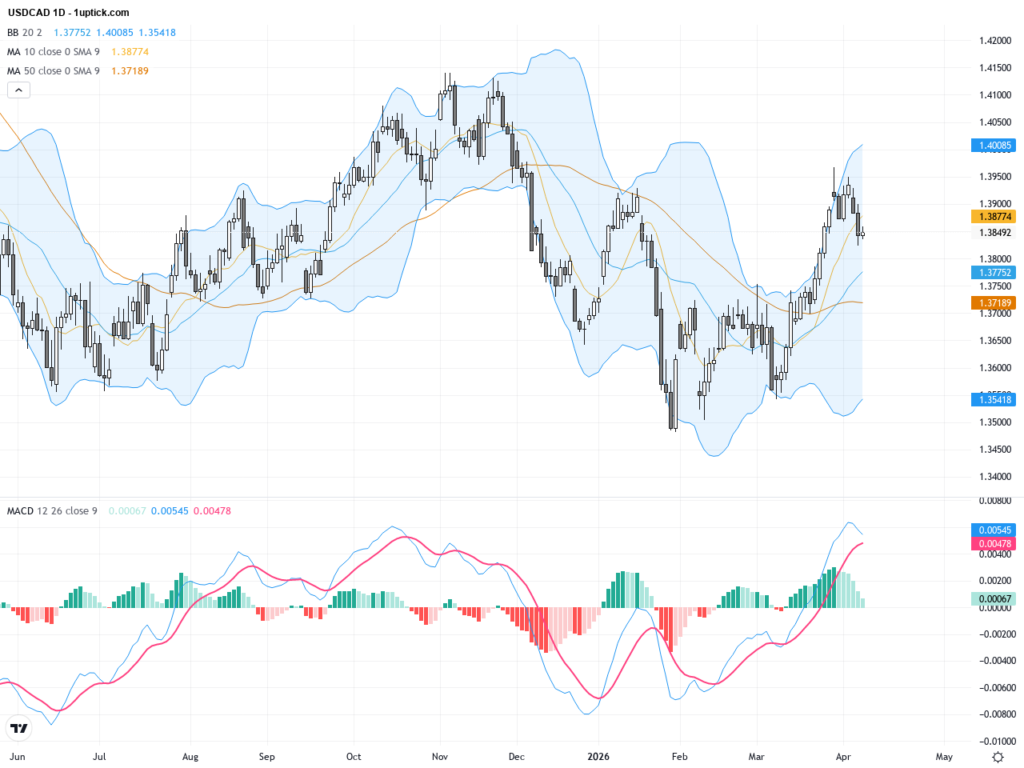
On the daily chart, USDCAD has shown a clear downtrend from recent highs around 1.41405. The pair is hovering near the 200-day EMA at 1.3831, with prices positioned below the 50-day moving average at 1.37136, confirming bearish sentiment. Bollinger Bands, after contracting, are starting to widen, indicating increasing volatility ahead. The MACD remains in negative territory with expanding bearish momentum, reinforcing the downtrend unless prices break and hold above the 200-day EMA and Bollinger midline, which would signal a potential trend reversal.
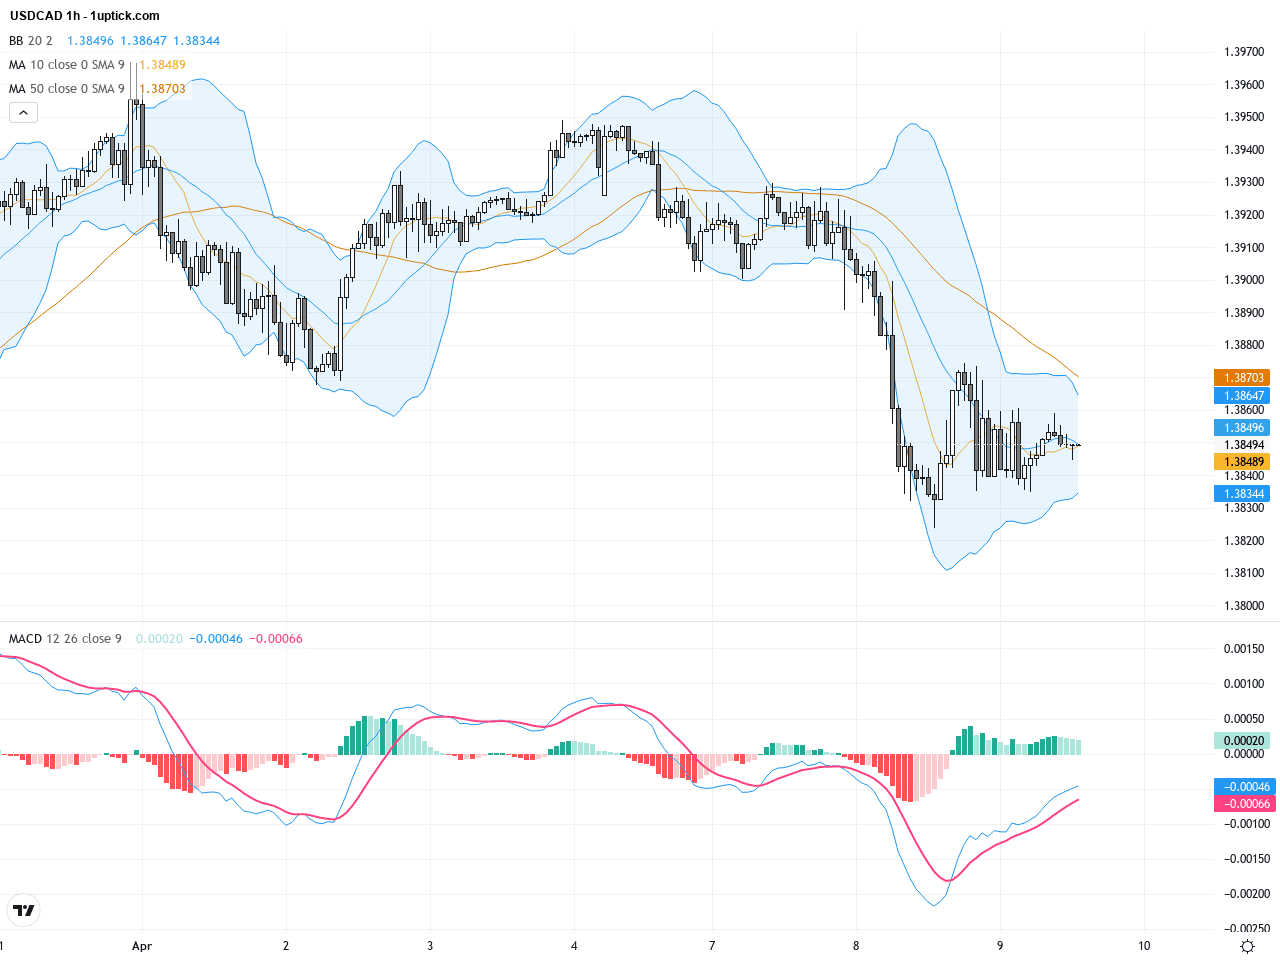
The hourly chart over the last 3-5 days depicts multiple tests of strong support near 1.3730, with price action forming a descending wedge pattern. Short-term moving averages are trending lower, but MACD recent attempts to cross upward and RSI nearing oversold territory suggest a possible short-term rebound. Bollinger Bands remain narrow, reflecting consolidation. Traders should watch if price can break above resistance around 1.3840 to confirm upside momentum or fall below 1.3730 to continue the downtrend.
Technical Trend: Overall Trend: Cautiously Bearish with sideways consolidation in the short term.
USDCAD faces mixed technical and fundamental pressure. The 200-day EMA is a critical resistance zone; a clear break below this level on daily closes would validate a renewed downtrend. The hourly chart’s wedge pattern suggests a potential short-term bounce, but confirmation is needed through a break above resistance levels near 1.3840. Momentum indicators like MACD and RSI highlight potential shifts but lack decisive confirmation. Market volatility is likely to increase given recent geopolitical developments and energy price shifts, making it essential for traders to watch volume and key price levels closely.Today’s GMT+1 economic calendar includes several European and Japanese data releases, such as Japan’s Consumer Confidence Index and Germany’s Trade Balance. However, none of these are expected to have a direct impact on USDCAD. Key US data releases this afternoon at 14:30 HKT, including Personal Consumption Expenditures (PCE) and core PCE readings, will be crucial. Stronger-than-expected US data would likely boost the US dollar, applying upward pressure on USDCAD, whereas weaker data may depress the USD and favor a lower USDCAD rate. Traders should be cautious around these releases.
Resistance & Support

The above financial market data, quotes, charts, statistics, exchange rates, news, research, analysis, buy or sell ratings, financial education, and other information are for reference only. Before making any trades based on this information, you should consult independent professional advice to verify pricing data or obtain more detailed market information. 1uptick.com should not be regarded as soliciting any subscriber or visitor to execute any trade. You are solely responsible for all of your own trading decisions.