


 |
| Gold V.1.3.1 signal Telegram Channel (English) |

USDJPY: Bullish Breakout Near 160 Signals Strong Trading Outlook and Key Technical Patterns
2026-04-13 @ 11:01
Over the past 48 hours, the USD/JPY pair has sustained its strong upward momentum, steadily climbing from yesterday’s closing price of 159.707. The opening saw a notable bullish gap, with prices touching up to 159.851, reflecting strong market confidence. This rally was driven by multiple factors, primarily the collapse of the US-Iran talks which heightened geopolitical risks, increasing demand for the US dollar as a safe haven and putting pressure on the Japanese yen. Additionally, rising oil prices have indirectly supported the dollar-yen pair, with Citi’s recent report highlighting Brent crude’s strength helping the USD maintain levels above key moving averages.
For the average investor, this means that during times of escalating geopolitical tensions and commodity volatility, the Japanese yen—traditionally seen as a safe haven—has weakened. Concurrently, growing expectations of further US interest rate hikes have bolstered the dollar amid global risk repricing, pushing USD/JPY higher amid positive catalysts. Overall, the market moves in USD/JPY reflect a combination of risk appetite shifts and geopolitical influences, making it essential for investors to monitor developments in US-Iran negotiations and global energy prices closely.
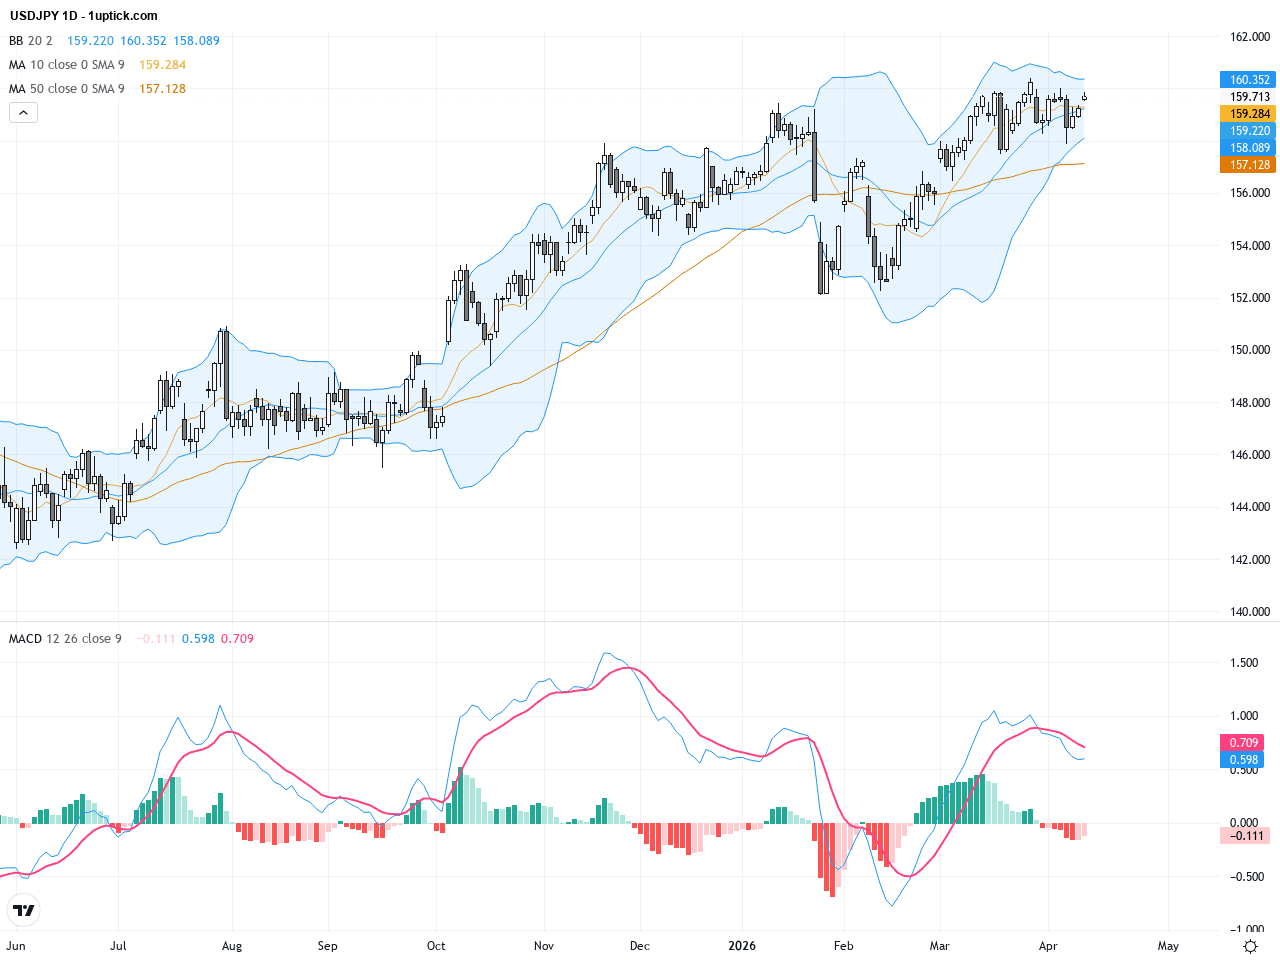
The daily chart illustrates a consistent uptrend for USDJPY, surging from around 158 towards 160. It has decisively broken above the 50-day moving average (approx. 157.25) and the 200-day moving average (close to 153.03), confirming a strong bullish trend. The Bollinger Bands are widening, with price pushing above the middle band and touching the upper band, signaling increased volatility and buyer dominance. The MACD is moving above its signal line, demonstrating positive momentum. The pattern suggests prolonged bullish control with price consolidating near the major resistance at 160, awaiting a breakout.

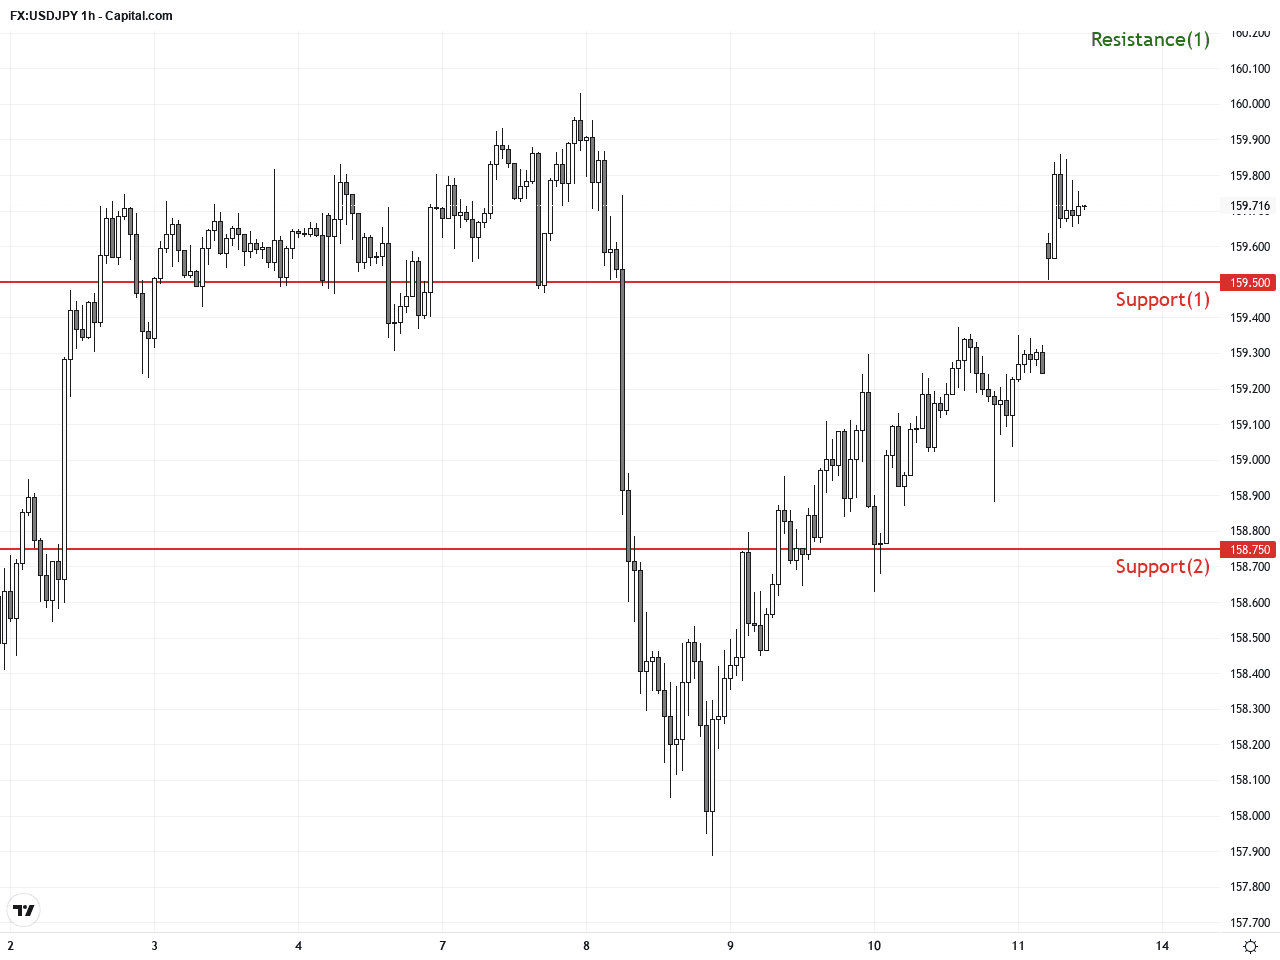
The hourly chart over the last 3-5 days reveals a short-term bullish rally. The price has broken through multiple moving averages, with short-term 5- and 10-period moving averages crossing upwards, forming a golden cross. Bollinger Bands are expanding, with prices hugging the upper band, indicating dominant bullish momentum. The MACD histogram is rising within positive territory, supporting further upward movement. A recent bullish engulfing candlestick pattern strengthens the outlook, favoring continued gains over the next 24 hours.
Technical Trend: The current trend is decisively bullish, supported by both fundamental and technical confirmations, favoring bullish positioning.
Technically, USDJPY’s daily chart has formed a head and shoulders bottom pattern starting about three weeks ago, with shoulders around 157-158 and the head near 159-160. The price has now broken above the neckline confirming the bullish trend. On the hourly chart, a strong bullish engulfing candle was observed recently, indicating increased buying pressure. MACD crossover in both daily and hourly timeframes suggests growing bullish momentum. Holding above the 159.50 support zone is crucial; a successful breakout above 160 is projected soon.Today’s global economic calendar shows no major data releases directly affecting USD or JPY. The US March existing home sales forecast is slightly lower, implying limited impact. ECB’s de Guindos speech is scheduled but expected to have neutral influence. Traders should remain cautious about Middle East geopolitical developments as they remain key drivers of USDJPY volatility. Overall, no significant economic events today expected to directly impact USDJPY price movement.
Resistance & Support
The above financial market data, quotes, charts, statistics, exchange rates, news, research, analysis, buy or sell ratings, financial education, and other information are for reference only. Before making any trades based on this information, you should consult independent professional advice to verify pricing data or obtain more detailed market information. 1uptick.com should not be regarded as soliciting any subscriber or visitor to execute any trade. You are solely responsible for all of your own trading decisions.