


 |
| Gold V.1.3.1 signal Telegram Channel (English) |
USDJPY: Head and Shoulders Pattern Signals Potential Downside; Key Support at 159
2026-04-10 @ 11:01
Over the past 48 hours, the USD/JPY pair has experienced notable volatility, rising to around 159.15 during Asian trading hours and hovering close to yesterday’s closing price of 159.16. Market movement was primarily driven by the fragile ceasefire agreement between the US and Iran, which caused investor sentiment to fluctuate. Initially, the ceasefire news strengthened the Japanese yen, causing a dip in USD/JPY, but the pair stabilized and slightly recovered as traders focused on the upcoming US CPI data release.
Meanwhile, the US dollar index dipped sharply by 0.71% on Wednesday to a four-week low, reflecting the softness in the dollar following easing tensions in the Middle East. The yen surged on the ceasefire announcement due to safe-haven demand, temporarily pushing USD/JPY lower. However, as the market evaluated the sustainability of the ceasefire, USD/JPY stabilized late yesterday, with reduced volatility.
For the average investor, this recent market action is akin to watching two tense adversaries momentarily shake hands, with moods swinging as news fluctuates between positive and negative. The tug-of-war between the dollar and yen highlights how global political developments can directly sway currency rates, reminding investors to exercise caution and maintain flexible strategies ahead of key data releases.

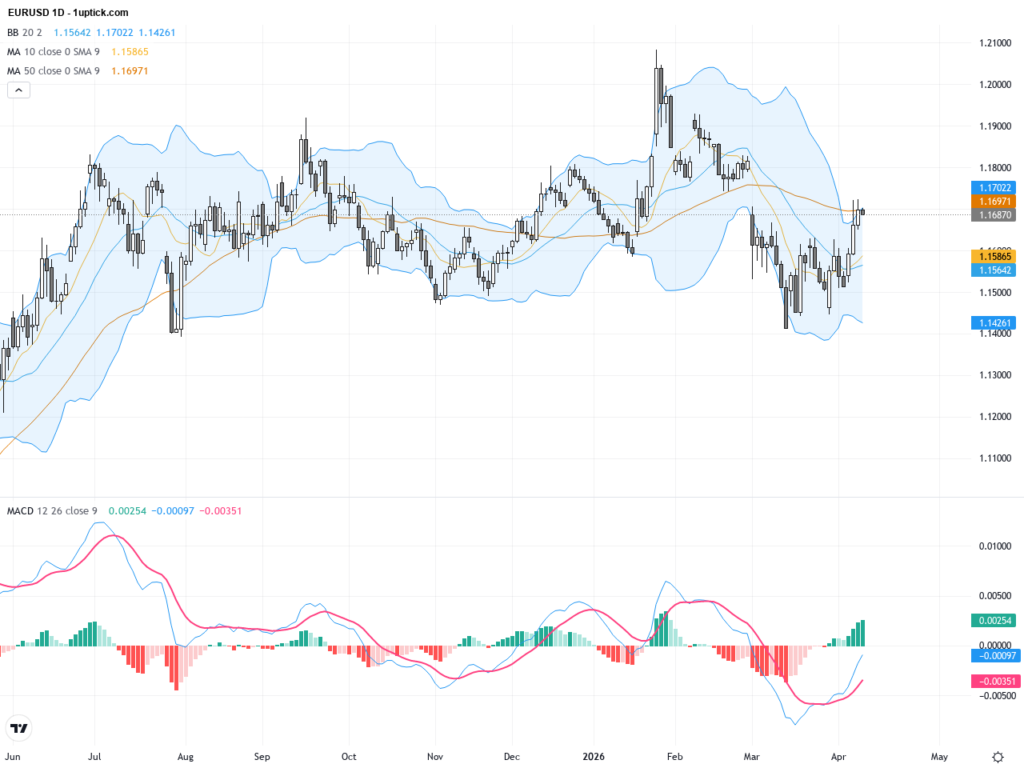
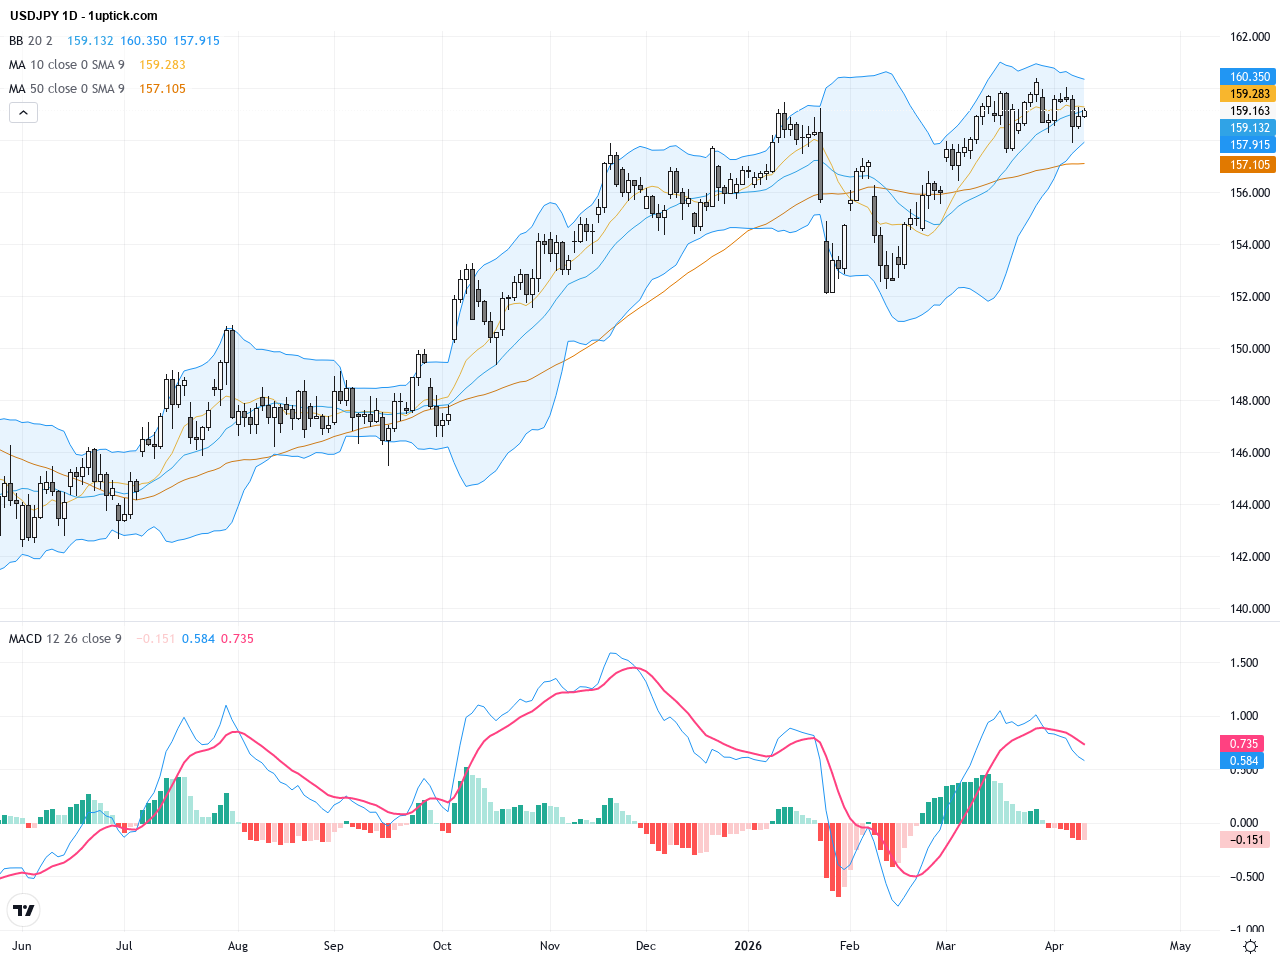
The daily chart shows USDJPY in a long-term uptrend, but the price has recently softened near the key resistance around 160. The MACD indicator on the daily timeframe reveals bearish divergence, and the price has repeatedly tested the 20-day Simple Moving Average (SMA) at 159.19 without a clear breakout. This has resulted in a classic head and shoulders pattern formation, signaling potential downside risk. Bollinger Bands indicate that price is near the upper band with tightening volatility, suggesting a possible increase in price swings ahead.
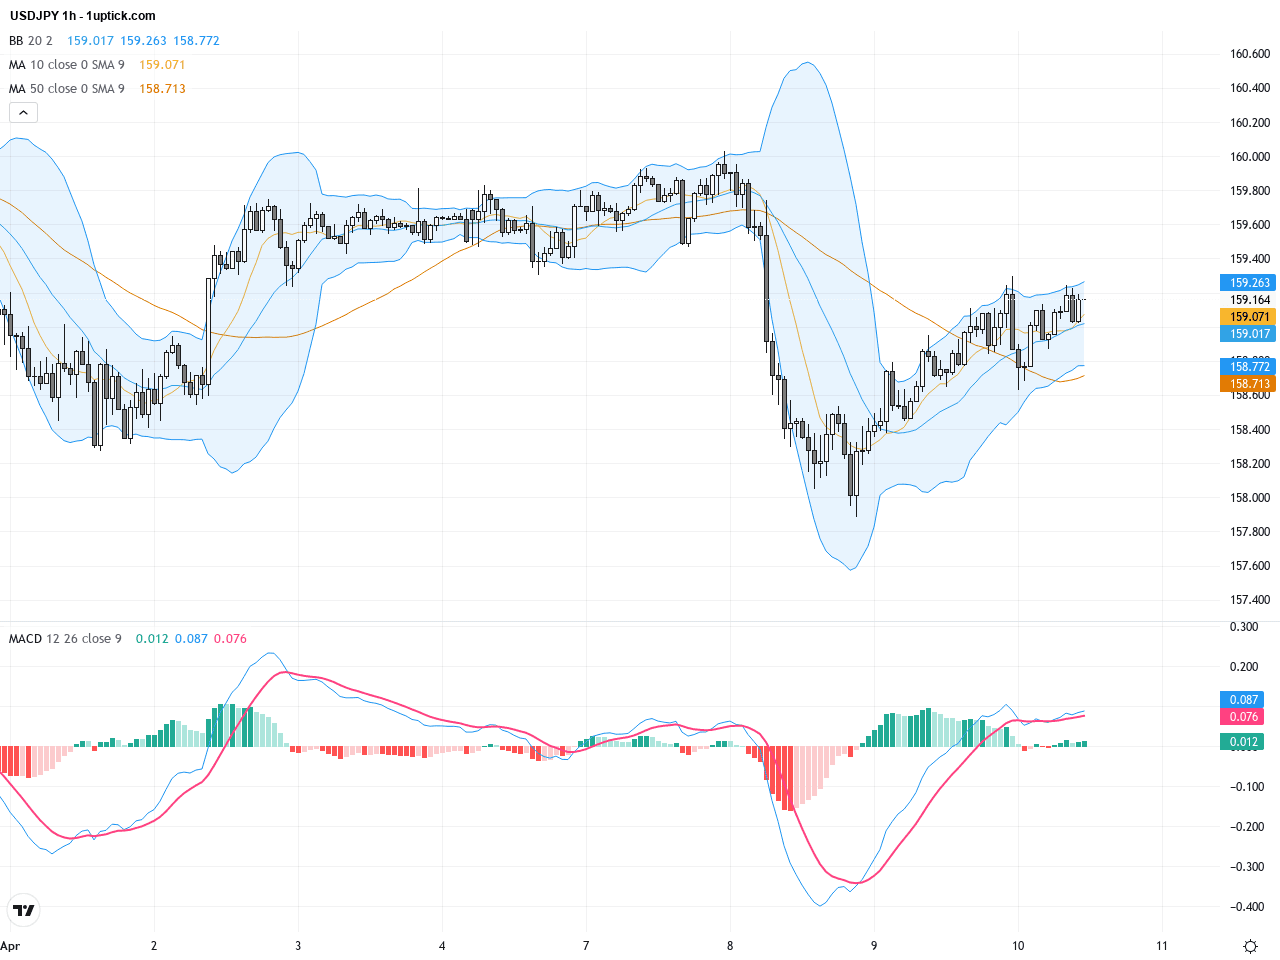
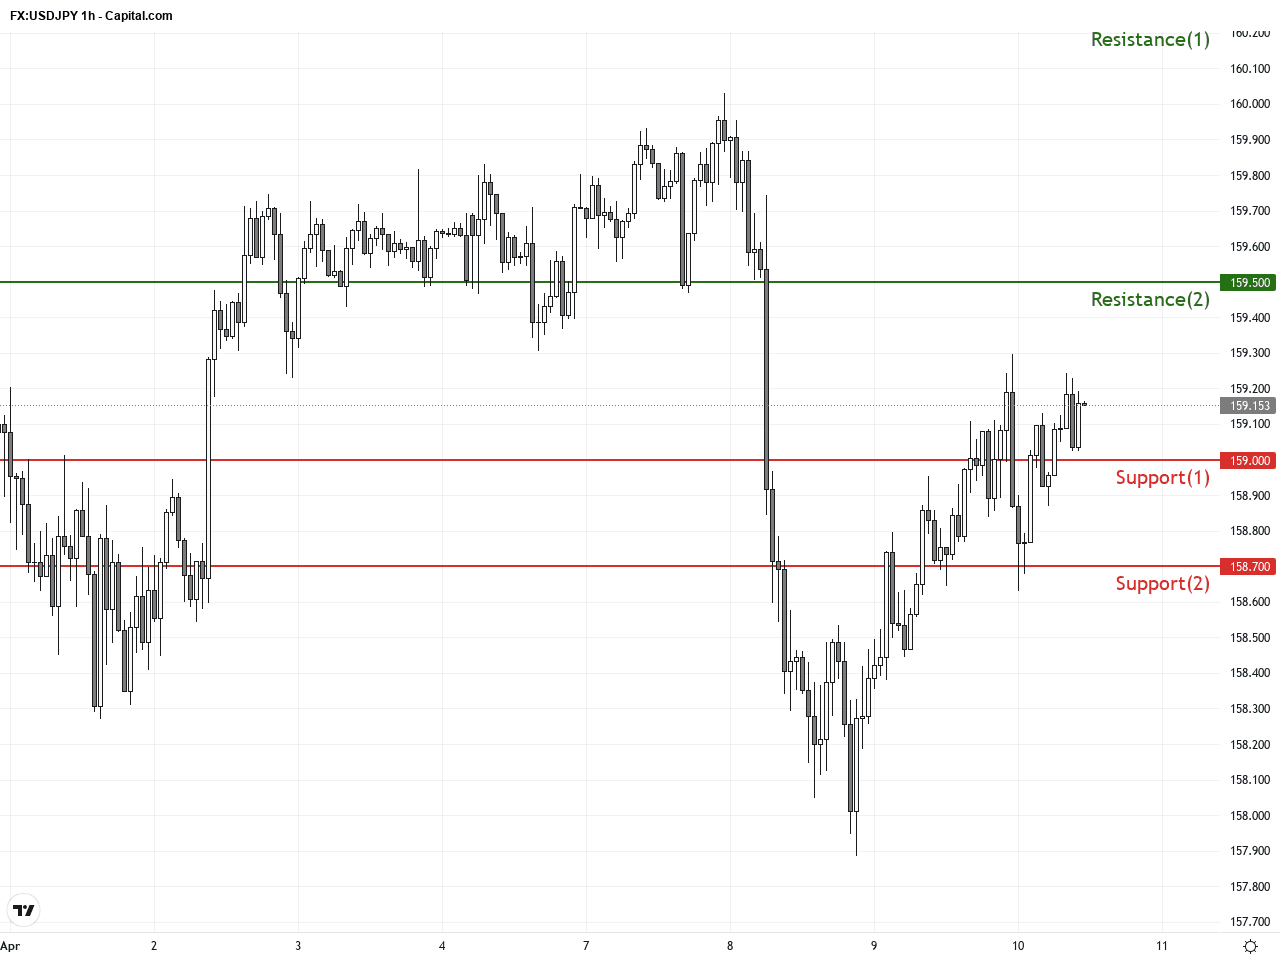
On the hourly chart over the past 3 to 5 days, USDJPY exhibits choppy upward momentum with multiple 5- and 20-period moving averages crossovers, reflecting uncertain short-term momentum. The MACD histogram is weakening, signaling reduced bullish pressure. Price has been consolidating between 158.7 and 159.2, with a recent bearish engulfing candlestick pattern suggesting a likely retracement in the next 24 hours. Traders should watch for reactions around the 159 level support.
Technical Trend: The current trend direction is ‘Cautiously Bearish’ with consolidation signals.
Technically, USDJPY is at a critical turning point. The head and shoulders pattern alongside bearish MACD divergence suggest short-term downside risks. Volume remains moderate, indicating that both bulls and bears are cautious. A breakdown below the 159 support zone would confirm a shift from consolidation to a bearish phase, potentially intensifying selling pressure. Traders should monitor economic releases and key technical levels closely to identify high-probability trade setups.According to the GMT+1 economic calendar, the most impactful event for USDJPY today is the US Consumer Price Index (CPI) release at 14:30. Forecasts anticipate a 3.3% year-over-year rise and a 0.9% month-over-month increase, along with core CPI figures. A CPI print above expectations is likely to strengthen the USD and support USDJPY gains; a weaker print could cause a retracement. There are no other significant economic releases today directly affecting the Japanese yen.
Resistance & Support
The above financial market data, quotes, charts, statistics, exchange rates, news, research, analysis, buy or sell ratings, financial education, and other information are for reference only. Before making any trades based on this information, you should consult independent professional advice to verify pricing data or obtain more detailed market information. 1uptick.com should not be regarded as soliciting any subscriber or visitor to execute any trade. You are solely responsible for all of your own trading decisions.