


 |
| Gold V.1.3.1 signal Telegram Channel (English) |

USDJPY Nearing Critical 160 Resistance with Volatility on the Rise
2026-04-01 @ 11:01
In the past 48 hours, USDJPY showed notable volatility, sliding slightly from yesterday’s close at 158.722 to hover around 158.45 during the Asian session, near a one-week low. This decline was mainly driven by hopeful signs of de-escalation in Iran tensions, weakening demand for the US dollar and strengthening the Japanese yen.
US President’s signals suggesting a possible end to the conflict with Iran further pressured the dollar index, reinforcing the multi-year structural weakness for the dollar and impacting the USD/JPY rate. Additionally, concerns about potential intervention by the Bank of Japan emerged as the pair flirted with the 160 level, triggering higher volatility but closing below 159.
For the average investor, these moves illustrate how swiftly geopolitical developments can sway global currency markets. When peace hopes rise, the dollar’s safe-haven appeal diminishes, prompting flows into the yen and causing short-term USDJPY adjustments. Staying attuned to geopolitical updates and central bank signals remains crucial to navigating this dynamic landscape.

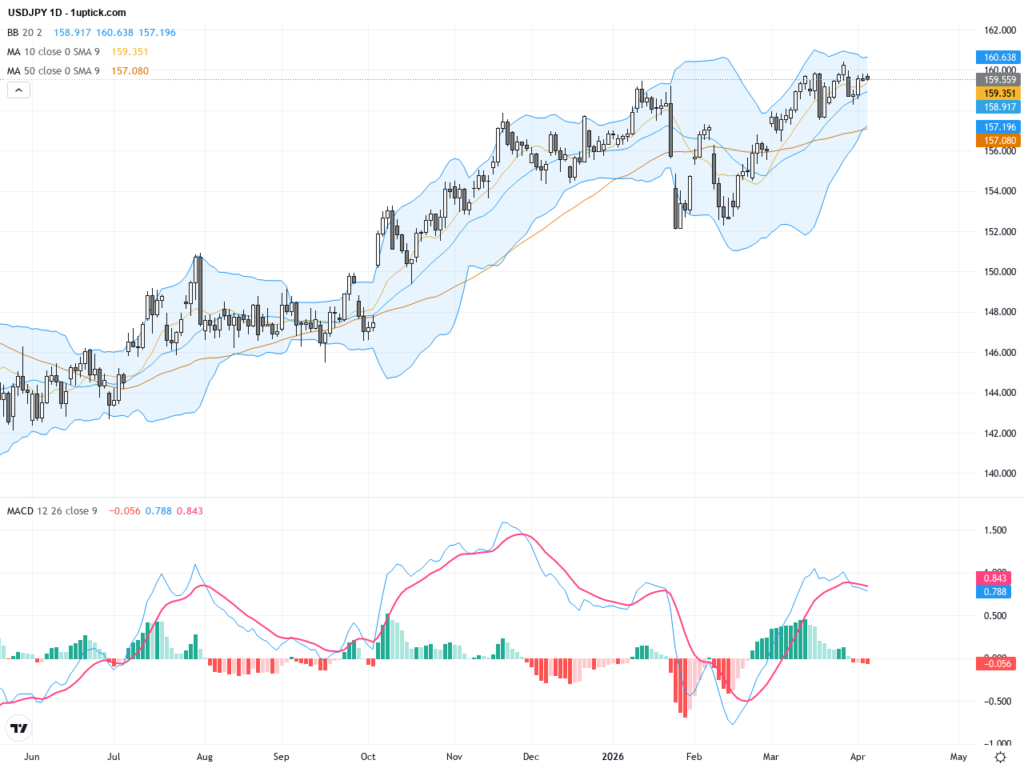
Analyzing the daily chart, USDJPY has been retracing from the yearly high of 160.23, with the 50-day and 200-day moving averages still in a bullish alignment, signaling a longer-term uptrend. The Bollinger Bands appear narrowing with price hugging the lower band, suggesting a potential short-term bounce. The MACD histogram remains below zero but is contracting, indicating bearish momentum is fading. The overall daily trend is neutral-to-bullish, with key attention on whether the 158.0 support will hold amid recent pullback.

On the hourly chart covering the last 3-5 days, USDJPY shows range-bound behavior with moving averages intertwined, reflecting indecision. Price repeatedly fails to break above the near-term 159.0 resistance, with Bollinger Bands narrowing, a signature of impending volatility expansion. The MACD is forming a minor bullish crossover near zero, hinting at a potential move within the next 24 hours. The recent engulfing candlestick suggests a short-term rally, but confirmation from volume is necessary.
Technical Trend: USDJPY is in a cautiously bullish consolidation phase, with tightening price ranges hinting at an imminent breakout.
USDJPY is trading in a cautious bullish consolidation between the psychological 160 resistance and 159.00 levels on the daily chart. The hourly engulfing candlestick signals a potential bounce, but overall momentum is still uncertain. Watch for a decisive break above 160, which could trigger heightened volatility and potential market intervention fears. Support at 158 will be critical; dropping below would increase downside risk.Today’s economic calendar features Japan’s 1Q Tankan Manufacturing and Non-Manufacturing Index releases at 01:50 GMT+1 (08:50 HKT), both beating forecasts (17 and 36 respectively). Strong readings will likely bolster the Yen against the USD, exerting downward pressure on USDJPY. While other global manufacturing PMIs are released, the Japanese data is the most directly relevant event for USDJPY today and will influence the intraday trading outlook.
Resistance & Support

The above financial market data, quotes, charts, statistics, exchange rates, news, research, analysis, buy or sell ratings, financial education, and other information are for reference only. Before making any trades based on this information, you should consult independent professional advice to verify pricing data or obtain more detailed market information. 1uptick.com should not be regarded as soliciting any subscriber or visitor to execute any trade. You are solely responsible for all of your own trading decisions.