


 |
| Gold V.1.3.1 signal Telegram Channel (English) |
USDJPY Trading Outlook: Pressure Builds Near 160 Resistance Amid Intervention Concerns
2026-04-08 @ 11:01
Over the past 24 to 48 hours, the USD/JPY currency pair experienced substantial volatility, briefly surging to a session high around 160.50 before plunging below 159.00 to close near 158.43—significantly lower than the previous day’s close of 159.52. This dramatic price movement was primarily driven by the ongoing uncertainty surrounding ceasefire talks in the Middle East, which crushed the oil premium expectations and consequently pressured the dollar-yen exchange rate.
The stalled ceasefire discussions, coupled with the looming US deadline for Iran to reopen the Strait of Hormuz set by former President Trump, intensified market risk-off sentiment that initially pressured the yen. However, soaring oil prices, weak US household spending data, and growing speculation about a potential Bank of Japan rate hike created a complex environment, resulting in heightened volatility. Adding to market anxiety is the possibility of intervention by the Japanese government to support the yen, especially as USD/JPY flirted around the critical 160 level, prompting traders to stay cautious.
In simpler terms for the average investor, the USD/JPY pair has been riding a rollercoaster caused by geopolitical tensions pushing oil prices higher, conflicting market forces between risk aversion and oil-driven pressure on the yen, and looming government intervention. These factors combine to produce unpredictable swings in the currency price, underscoring the importance for investors to monitor geopolitical developments and central bank policy signals carefully, as they will be key drivers for USD/JPY in the coming days.

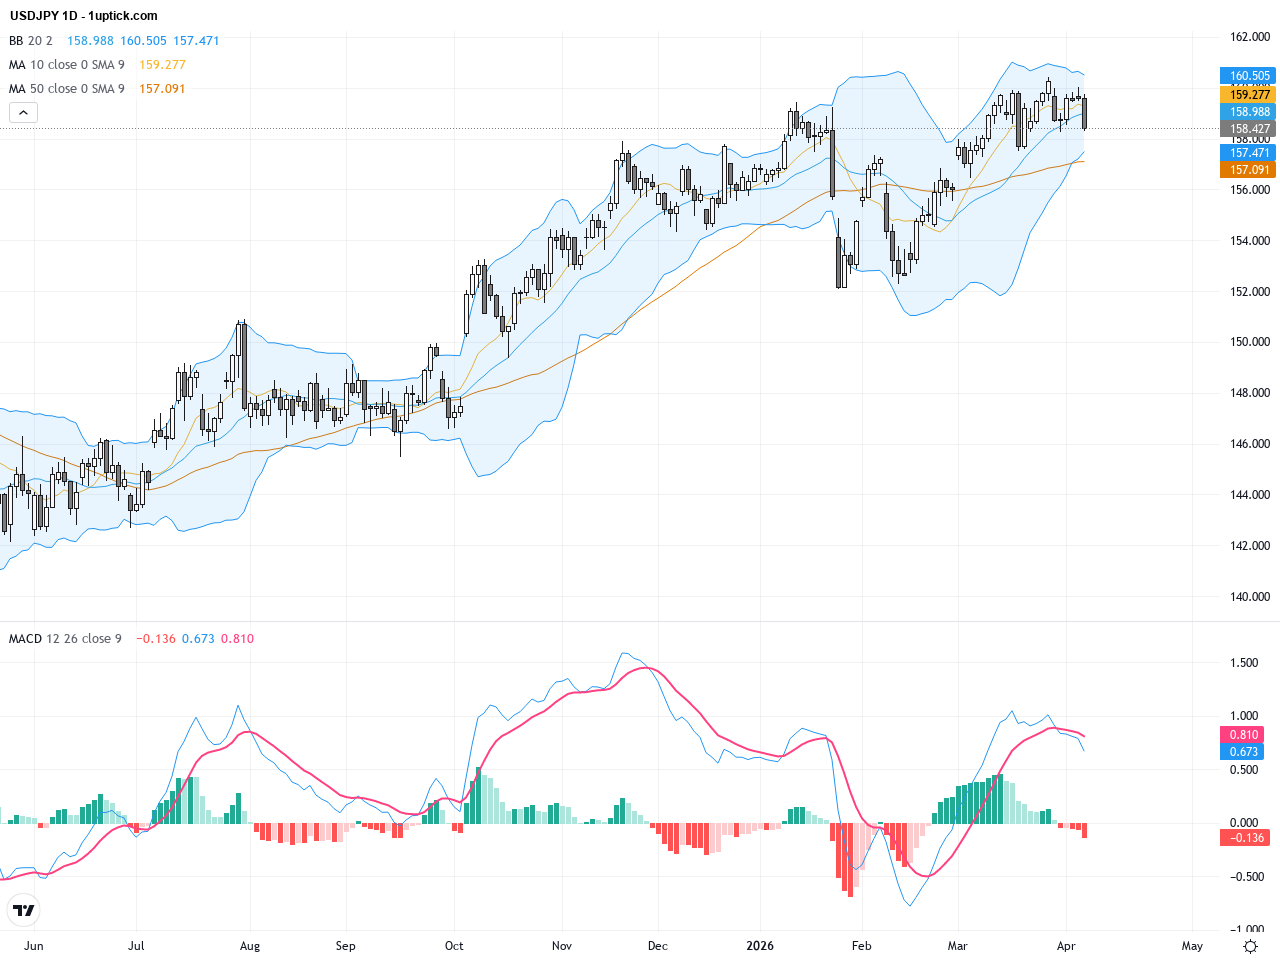
The daily chart reveals a strong uptrend for USDJPY since the beginning of the year, staying well above both the 50-day and 200-day moving averages, confirming long-term bullish momentum. However, a rising wedge pattern has formed near the 160 round number, indicating increasing resistance. The Bollinger Bands are narrowing, suggesting a potential breakout or reversal ahead. The MACD remains positive but with shrinking histogram bars, signaling weakening momentum and warranting close monitoring for confirmation.

The hourly chart over the past 3 to 5 days shows USDJPY trading with high volatility near the 160 resistance level, with prices repeatedly testing and then falling back. Short-term moving averages (5 and 20 periods) are tightly intertwined, highlighting intense tussles between buyers and sellers. Bollinger Bands show prices hovering near the middle band, while a bearish MACD crossover indicates a possible short-term correction. A notable bearish engulfing candlestick reflects recent selling pressure, suggesting caution for the next 24 hours.
Technical Trend: Currently in cautious consolidation, with the medium to long-term trend maintaining a bullish bias but vulnerable to pullbacks.
Technically, USDJPY is consolidating near a crucial psychological resistance at 160. A solid breakout with supportive volume may fuel a fresh buying wave. Conversely, downside risks intensify if the pair breaks below 159 amid rate hike anticipation and intervention fears. The MACD bearish crossover combined with a recent bearish engulfing candlestick implies short-term bearish momentum. Traders should watch for volume and price action cues to identify high-probability trades.Today’s economic calendar highlights Japan’s February current account data, released early in the GMT+1 timezone, showing a strong non-seasonally adjusted surplus of 3932.7 billion JPY versus the forecasted 3550 billion. This underpins yen strength amidst broader market weakness. No significant US data is scheduled today that might directly sway USDJPY ahead of the FOMC member speech and minutes release later in the day, which could be pivotal for the pair’s direction.
Resistance & Support

The above financial market data, quotes, charts, statistics, exchange rates, news, research, analysis, buy or sell ratings, financial education, and other information are for reference only. Before making any trades based on this information, you should consult independent professional advice to verify pricing data or obtain more detailed market information. 1uptick.com should not be regarded as soliciting any subscriber or visitor to execute any trade. You are solely responsible for all of your own trading decisions.