


 |
| Gold V.1.3.1 signal Telegram Channel (English) |
WTI Crude Oil: Geopolitical Risks Surge with Key Resistance Breakout Signaling New Bull Trend
2026-04-07 @ 06:03
Over the past 24 to 48 hours, the WTI Crude Oil market showed significant volatility, with prices sharply oscillating near their highs. Referencing the closing price of $112.41 on April 6, 2026, the market experienced swings from an earlier high of $115.48 down near $112 during this recent session.
This price action was primarily driven by escalating geopolitical tensions. Notably, President Trump’s fresh threat that “Iran can be taken out in one night” heightened concerns over Middle East stability, pushing oil prices higher initially. However, subsequent reports of indirect ceasefire proposal talks between the U.S. and Iran contributed to a pullback. The strategic Strait of Hormuz blockade risk remains at the forefront, intensifying fears over potential supply disruptions.
Adding to the dynamics, North American crude demand remains robust amid constrained supplies, with U.S. oil premiums reaching record heights. The global energy market remains tightly wound amid geopolitical tensions and chokepoint vulnerabilities, keeping traders on edge.
For the average investor, this period of sharp oil price volatility illustrates how international political risks directly impact commodity prices. This uncertainty serves as a reminder that near-term market moves can hinge heavily on geopolitical developments and policy rhetoric, reinforcing the need to monitor global events closely.

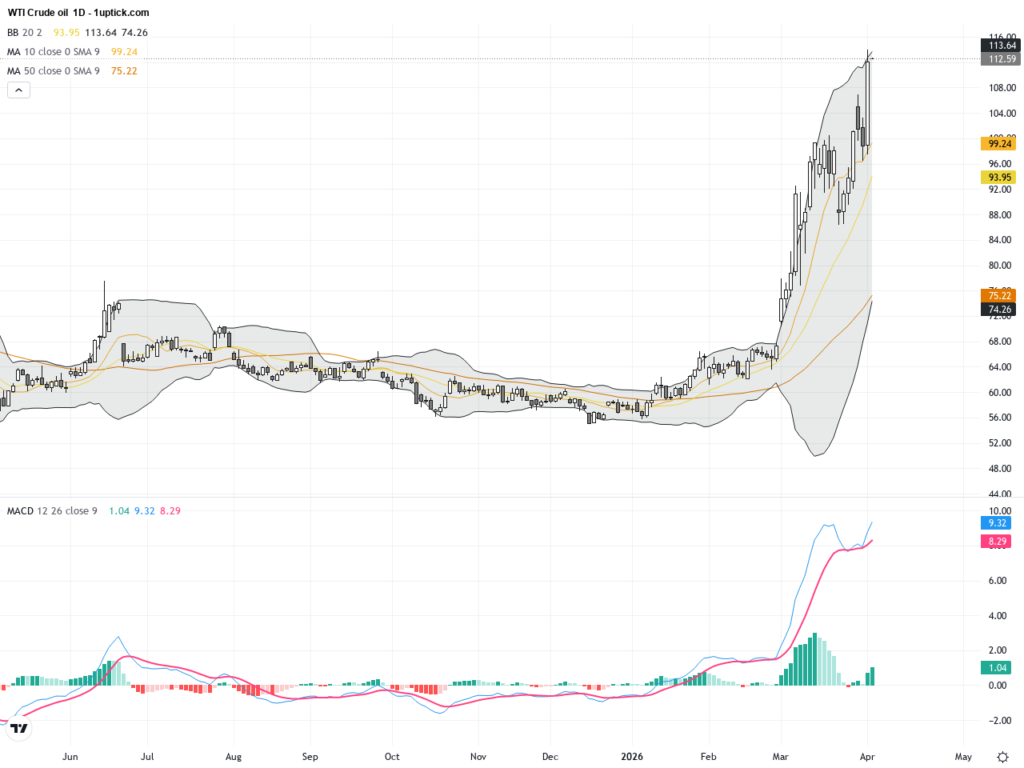
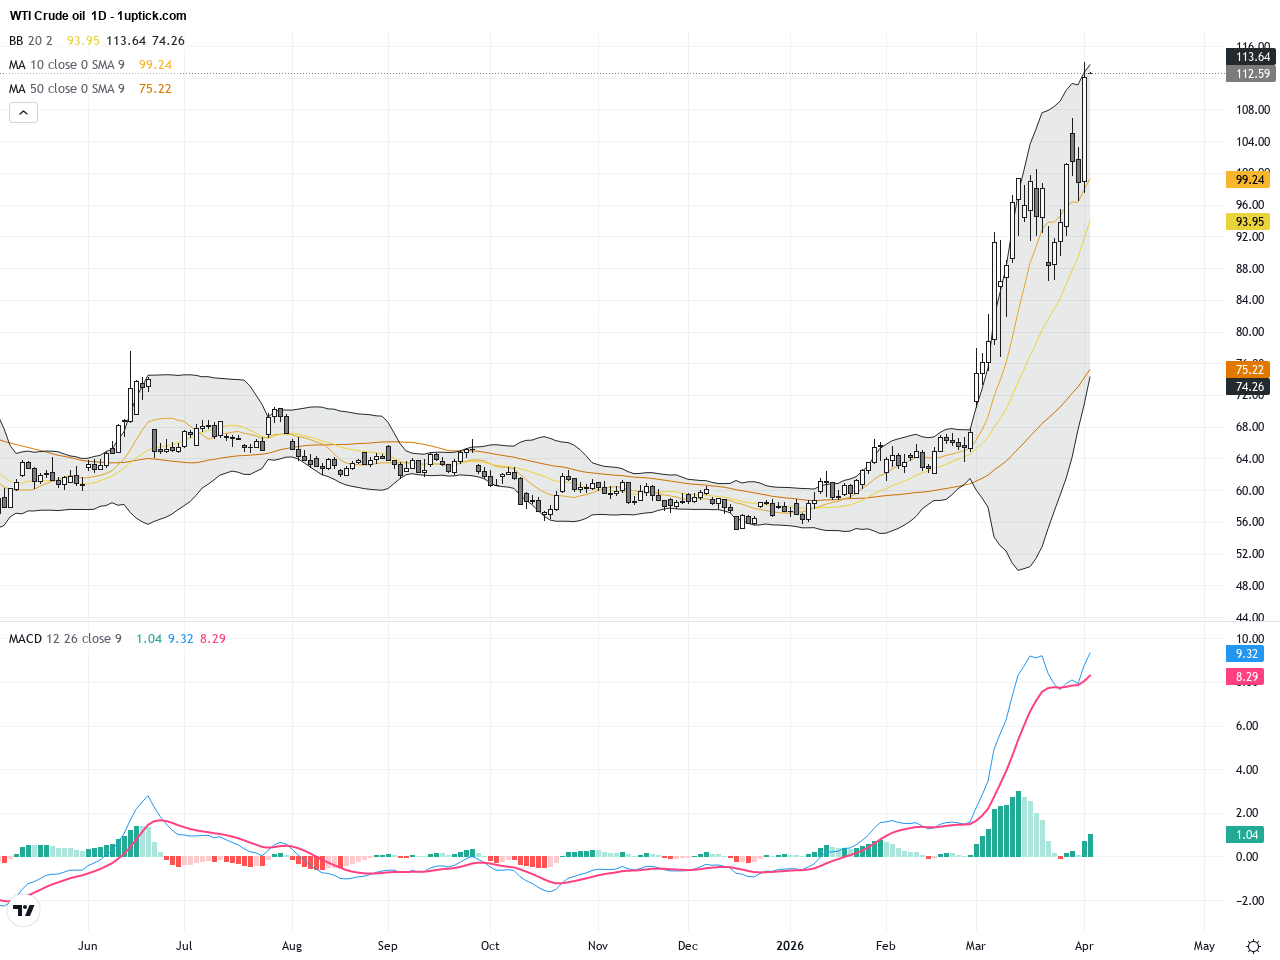
The daily chart of WTI Crude Oil depicts a strong upward trajectory, beginning from around $98 three days ago to over $112 by yesterday’s close. The price remains well above both the 20-day and 50-day moving averages, confirming a solid short to medium-term bullish stance. Bollinger Bands are widening, indicating increased volatility, while the MACD shows a bullish crossover with expanding histogram bars, signaling strong upward momentum. Overall, the trend is clearly upward, favoring both short-term and longer-term buying opportunities.
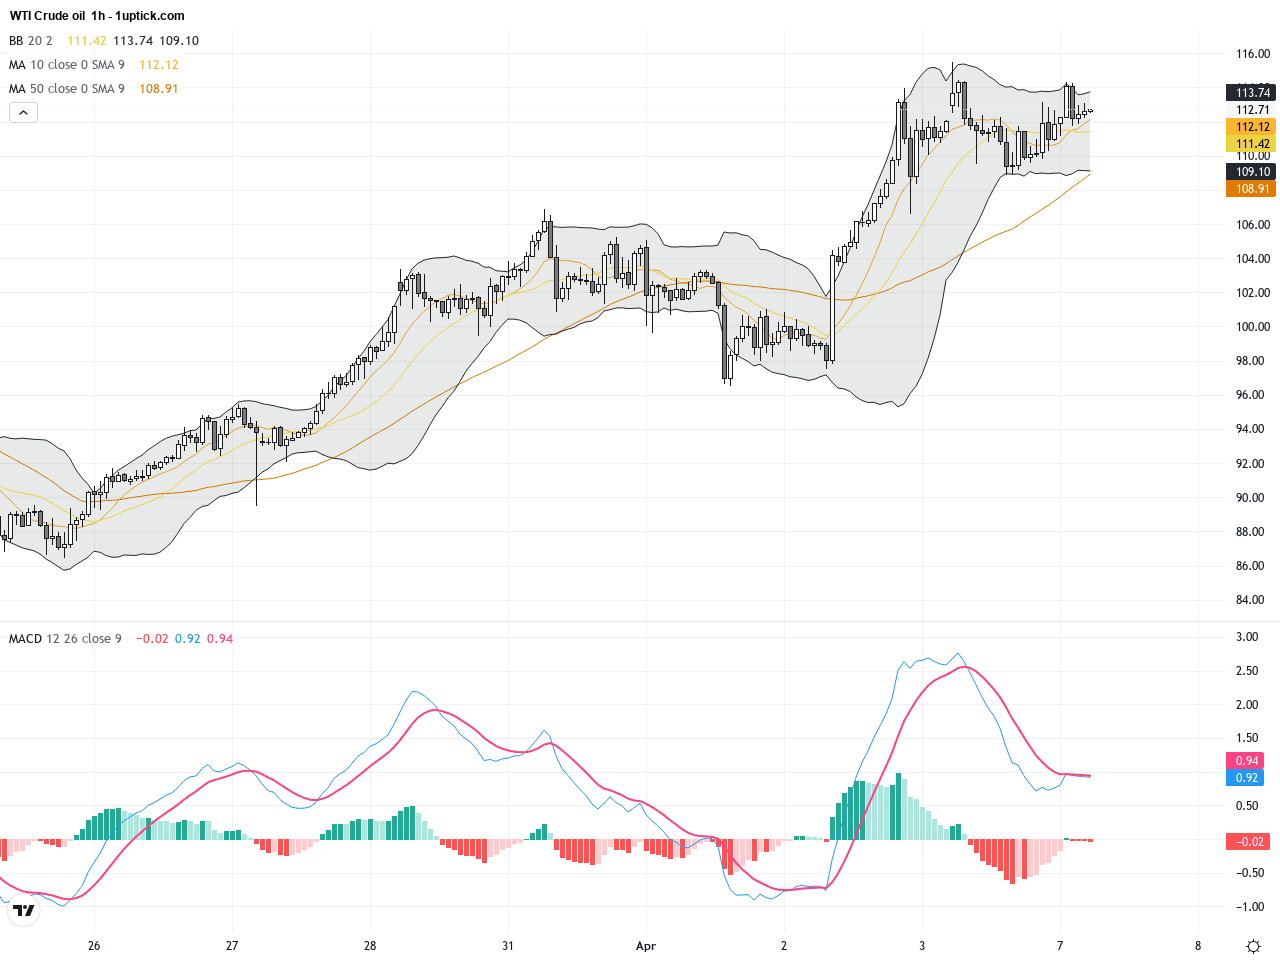
On the hourly timeframe, WTI has experienced elevated volatility over the past 3 to 5 days, consolidating between $111 and $115 and forming a bullish flag pattern since the sharp gap-up move on April 3. The 10-EMA is providing steady support and MACD remains positive but hints at a slight consolidation. The recent bullish engulfing candlestick suggests a potential continuation upward in the next 24 hours. A breakout above the flag’s upper boundary could trigger a fresh rally.
Technical Trend: Decisively Bullish
From a technical perspective, the MACD bullish crossover accompanied by increasing histogram size indicates strong buying pressure. The expanding Bollinger Bands on the daily chart reflect heightened market volatility. Current price action is breaking above a consolidation zone forming a bullish flag pattern, a strong signal favoring further upside. The hourly chart’s recent bullish engulfing candlestick reinforces near-term bullish momentum. Overall, WTI shows pronounced bullish energy with technical structures validating potential price advances.Today’s GMT+1 economic calendar shows no major events directly impacting WTI Crude Oil prices. Traders should monitor upcoming geopolitical developments related to the US and Middle East, which remain the primary drivers of oil price fluctuations.
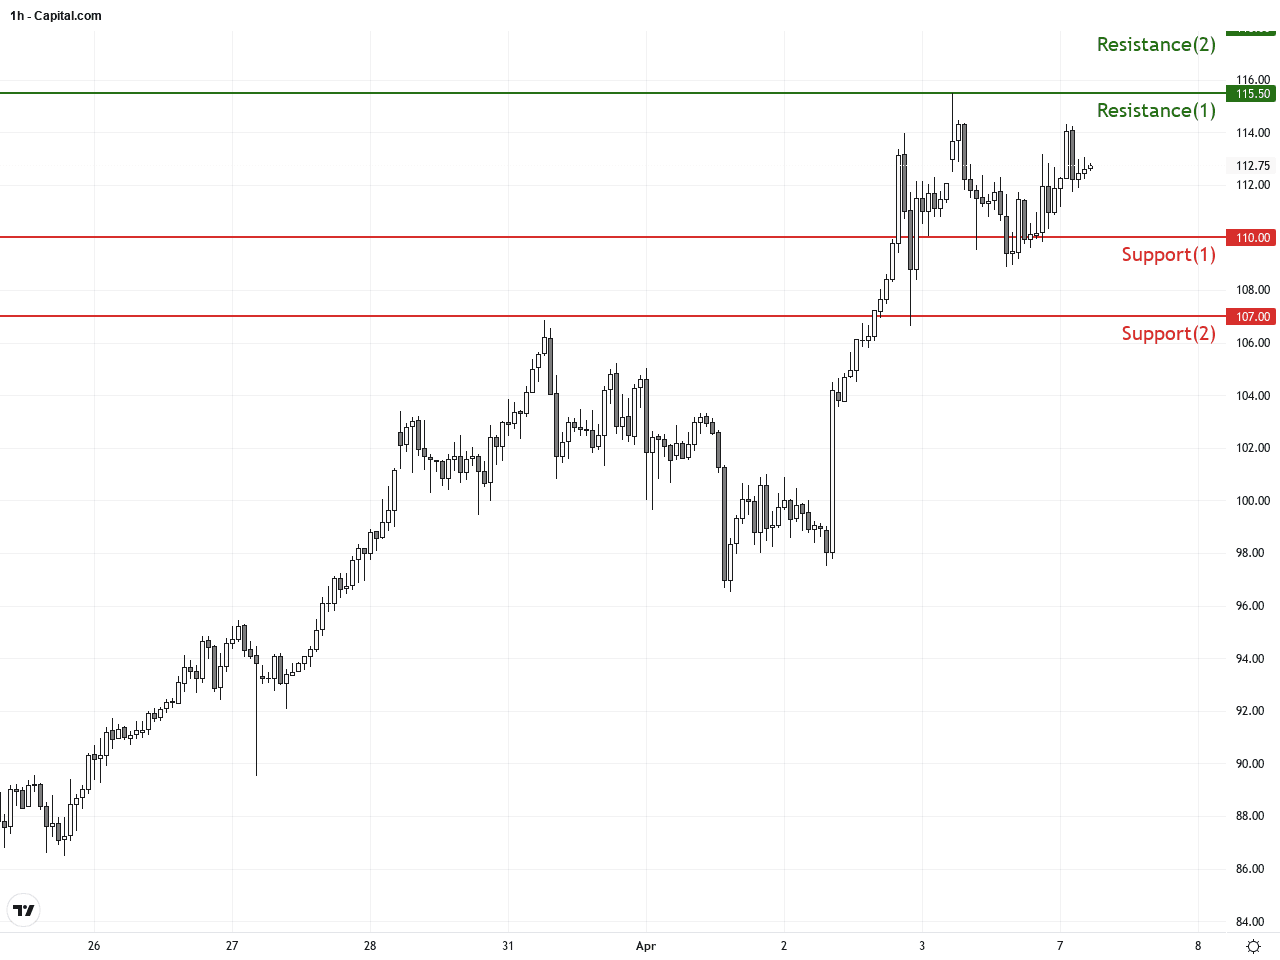
Resistance & Support
The above financial market data, quotes, charts, statistics, exchange rates, news, research, analysis, buy or sell ratings, financial education, and other information are for reference only. Before making any trades based on this information, you should consult independent professional advice to verify pricing data or obtain more detailed market information. 1uptick.com should not be regarded as soliciting any subscriber or visitor to execute any trade. You are solely responsible for all of your own trading decisions.