


 |
| Gold V.1.3.1 signal Telegram Channel (English) |

XAUUSD Gold Analysis: Key Support Holds and Bullish Signals Emerge
2026-04-03 @ 05:04
In the past 24 to 48 hours, the gold price (XAUUSD) has experienced significant volatility, closing at $4669.955 on April 2, 2026. Since then, the market dipped to a low near $4553, reflecting investor caution amid escalating global geopolitical tensions. Former President Trump’s recent tough rhetoric about taking “extremely hard” actions against Iran boosted oil prices and briefly knocked gold prices down, as funds partly shifted toward the energy sector. However, gold demonstrated resilience, gradually stabilizing around the $4700 mark, indicating investors’ continued demand for assets that hedge against uncertainty.
The news titled “Gold (XAUUSD) & Silver Price Forecast: Metals Rebound – Is the 17-Year Price Slide Over?” highlights gold’s stabilization near $4700, which bolsters bullish confidence. Holding above the crucial $4725 level would give bulls a clear “all-clear” signal. For average investors, the recent political instability has heightened gold’s appeal as a traditional safe haven. While short-term price swings remain influenced by news flow, the long-term fundamental driver of gold as a store of value remains strong.
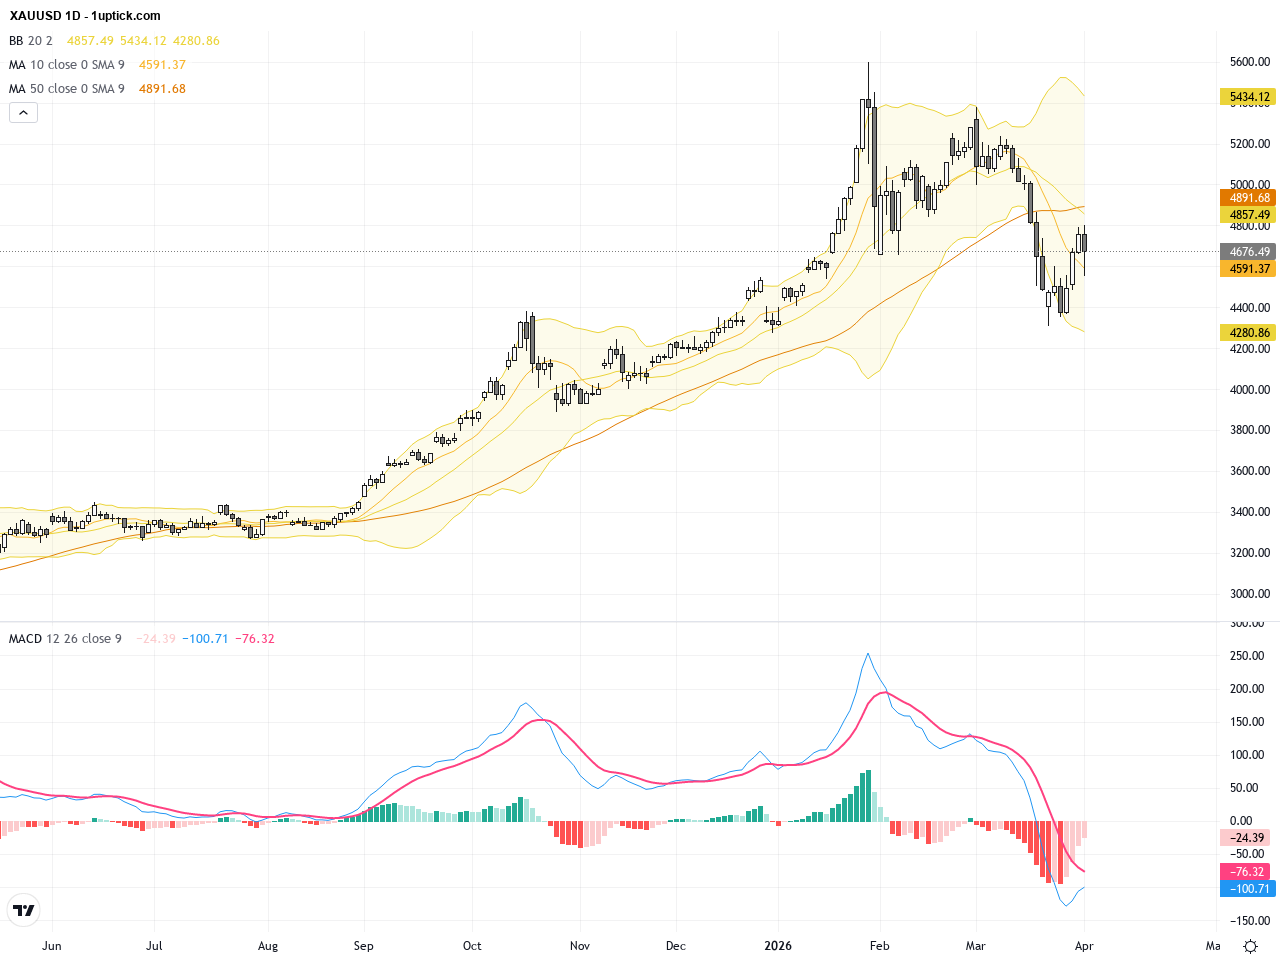
The daily chart illustrates XAUUSD’s gradual uptrend with price moving from the 4500 support zone toward recent highs near 4800. Bollinger Bands have begun to widen, indicating increasing volatility. The 20-day simple moving average is trending upward, offering dynamic support. MACD remains above the zero line, suggesting bullish momentum, though it shows signs of slowing. The overall outlook on the daily timeframe remains bullish, yet the near-term resistance has become more prominent.
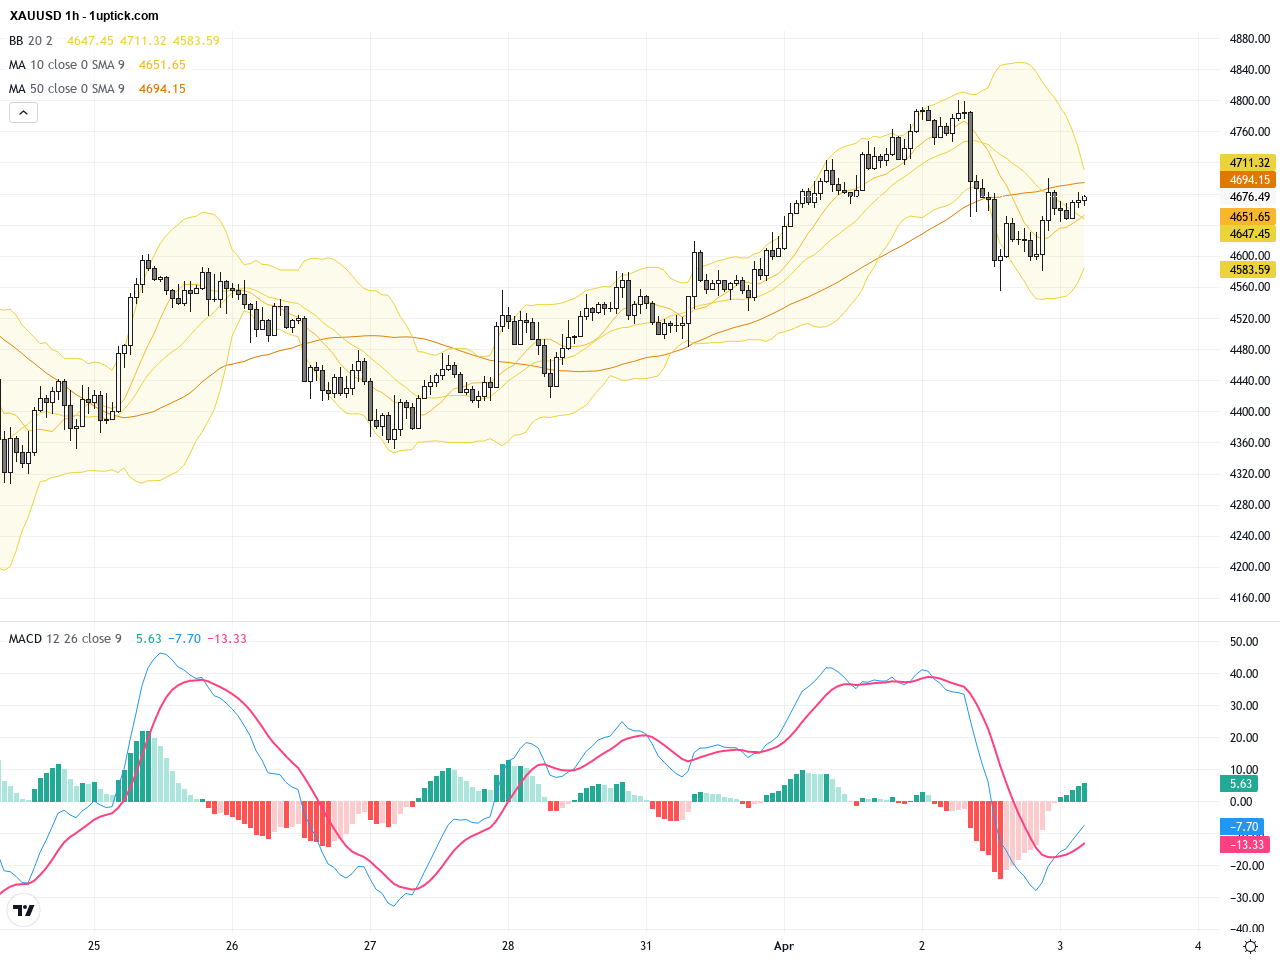
On the hourly chart covering the last 3-5 days, XAUUSD shows a clear consolidation followed by a breakout pattern forming a bullish flag. The MACD indicator has recently bullishly crossed, confirming strengthening momentum. The price has repeatedly bounced off the mid-Bollinger Band, indicating solid support. The appearance of a hammer candlestick pattern hints at buyer strength in the short term, setting the stage for a potential move toward the 4780 resistance level.
Technical Trend: XAUUSD is currently in a cautiously bullish trend, characterized by short-term consolidation within an overall upward bias. Price is holding key support zones with limited downside risk, awaiting a decisive breakout to confirm further gains.
Technically, XAUUSD has developed a bullish flag pattern since March 31, suggesting the potential for a continuation of its upward trend. The daily MACD hasn’t turned bearish, and widening Bollinger Bands indicate increased volatility ahead. The recent hammer candlestick on the hourly chart points to short-term buyer dominance. A breakout above 4750 could trigger a swift bullish rally. Monitoring volume and MACD momentum is essential to time entries optimally.Today’s economic calendar in GMT+1 includes significant U.S. releases such as Trade Balance, Exports and Imports data, and Weekly Jobless Claims at 14:30. These figures are critical to gauging USD strength, which inversely affects gold. Stronger-than-expected U.S. data could weigh on XAUUSD by strengthening the dollar, while weaker data might boost gold prices. Other global events like Australia’s Trade Balance and Switzerland’s CPI have limited direct impact on gold today.
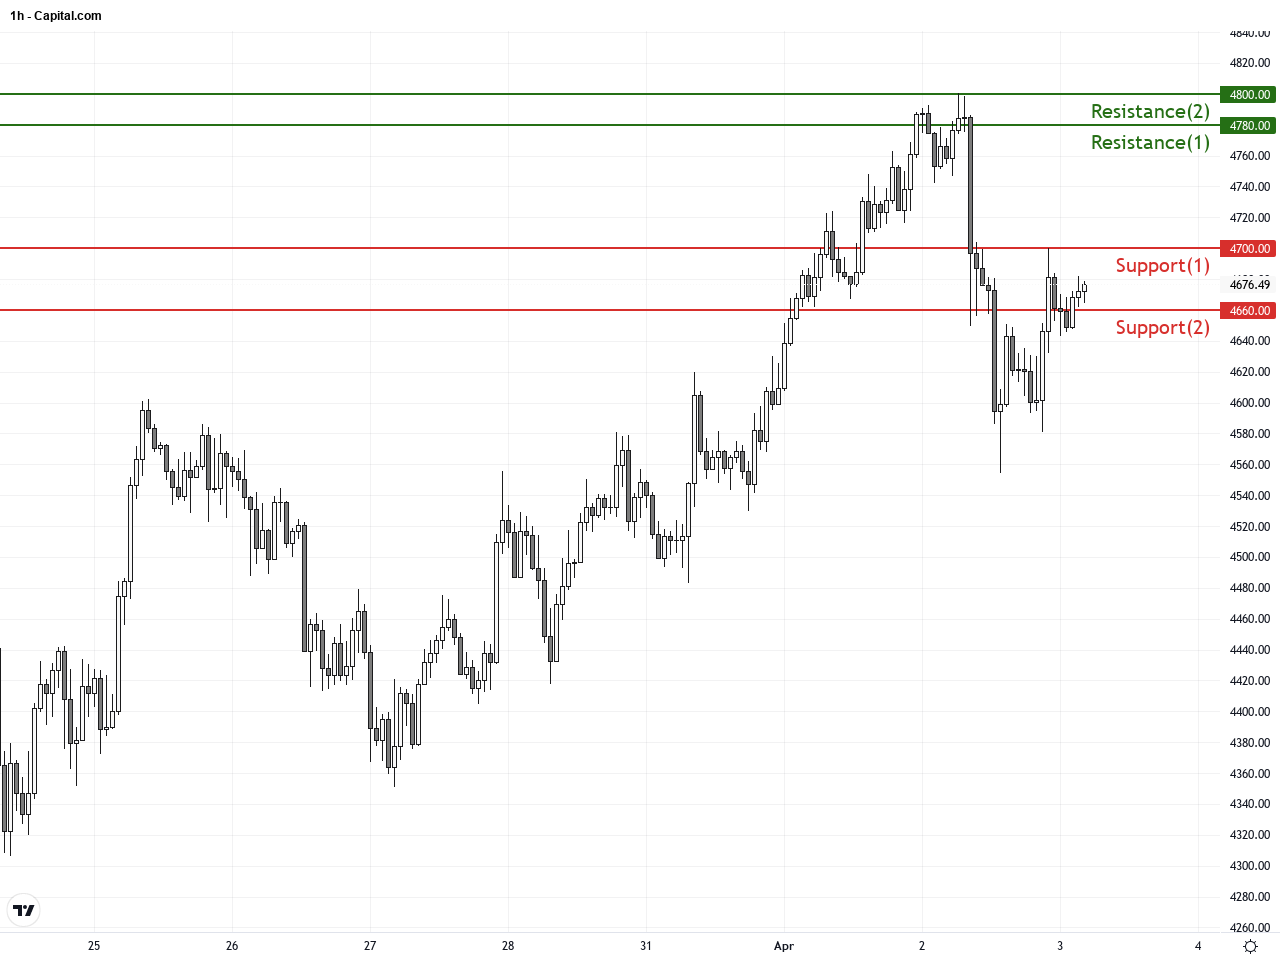
Resistance & Support
The above financial market data, quotes, charts, statistics, exchange rates, news, research, analysis, buy or sell ratings, financial education, and other information are for reference only. Before making any trades based on this information, you should consult independent professional advice to verify pricing data or obtain more detailed market information. 1uptick.com should not be regarded as soliciting any subscriber or visitor to execute any trade. You are solely responsible for all of your own trading decisions.