


 |
| Gold V.1.3.1 signal Telegram Channel (English) |

XAUUSD: Gold Tests Critical Resistance Amid Mixed Technical Signals and Market News
2026-04-09 @ 05:04
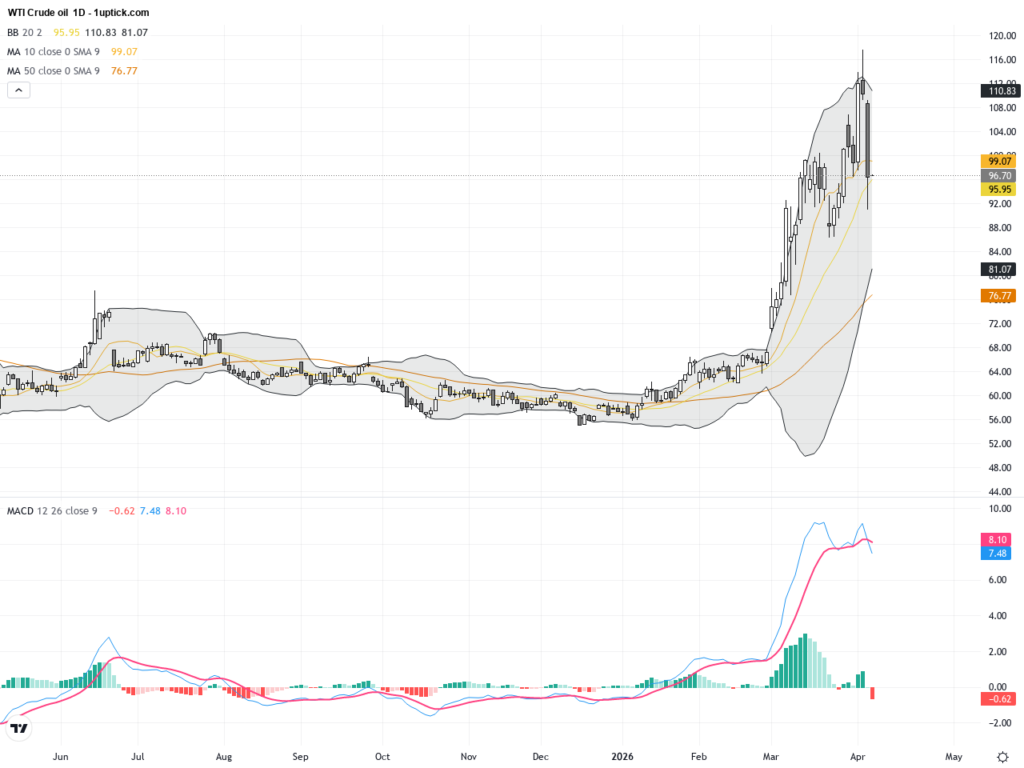
Over the past 24 to 48 hours, the gold market (XAUUSD) experienced notable volatility, with prices oscillating around yesterday’s closing price of $4,719.77, reaching highs near $4,858. Latest market news reveals that a two-week ceasefire agreement between the US and Iran has eased geopolitical tensions, boosting risk appetite. This development led to falling oil prices and propelled gold prices to a three-week high.
Although gold stalled near the critical $4,900 resistance level, signaling some pullback risk, long-term macroeconomic factors continue to underpin its strong demand and price. Amid economic uncertainty and shifting monetary policies, gold’s appeal as an inflation hedge and safe haven remains robust. For the average investor, recent price movements highlight gold’s dual role—not only as a protective asset but also as a vital store of value during global economic turbulence.
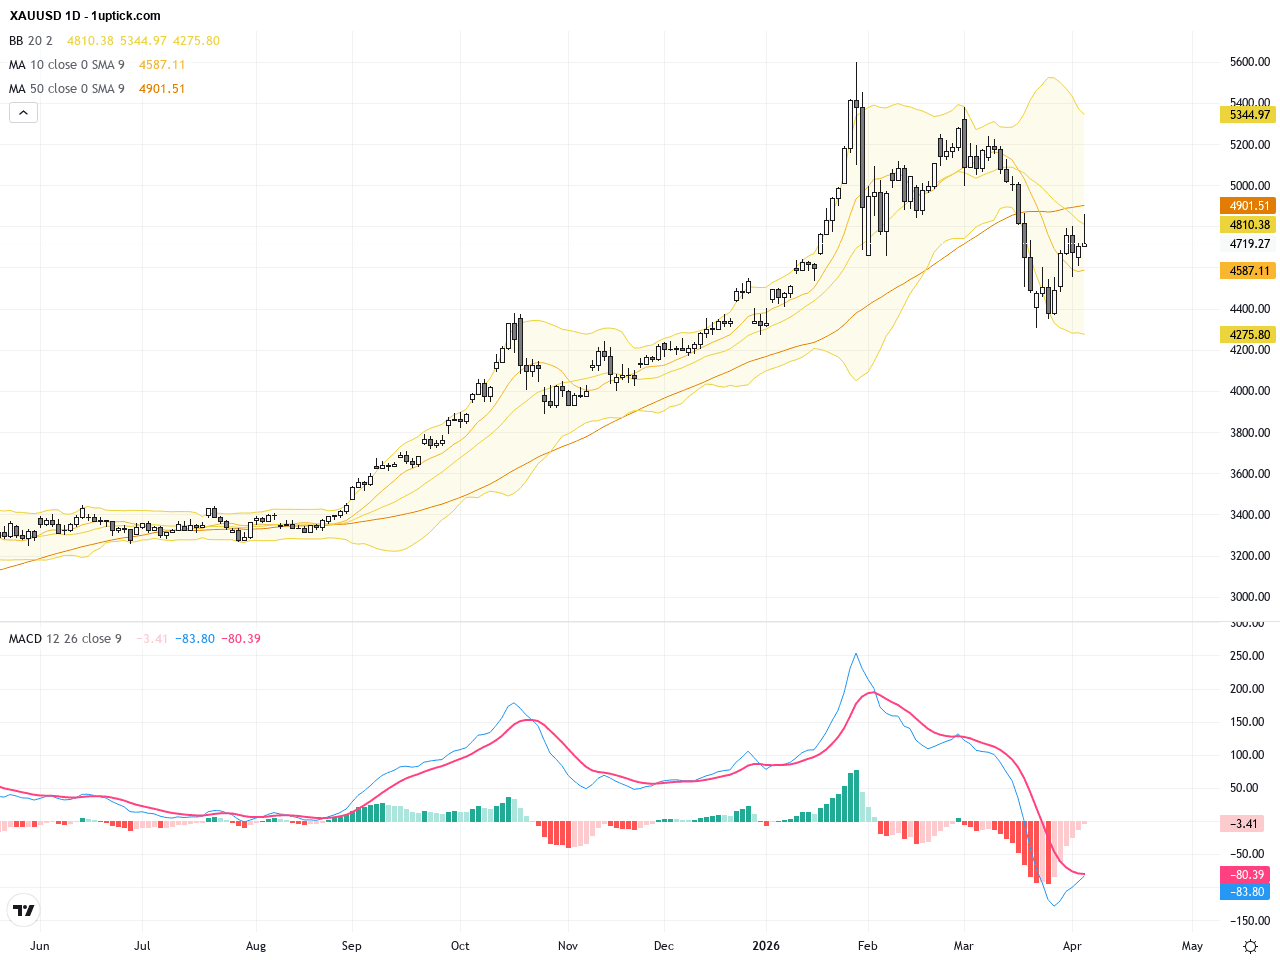
The daily chart shows a clear upward trend over the past week, with gold prices breaking above major moving averages including the 50-day MA on April 7 and 8, indicating sustained bullish momentum for the medium term. Bollinger Bands are contracting, suggesting reduced volatility, while MACD is near a peak signaling possible short-term momentum slowdown. A potential head and shoulders pattern has emerged around the recent highs near 4900, which traders should watch closely as it could mark a resistance zone and possible retracement area.
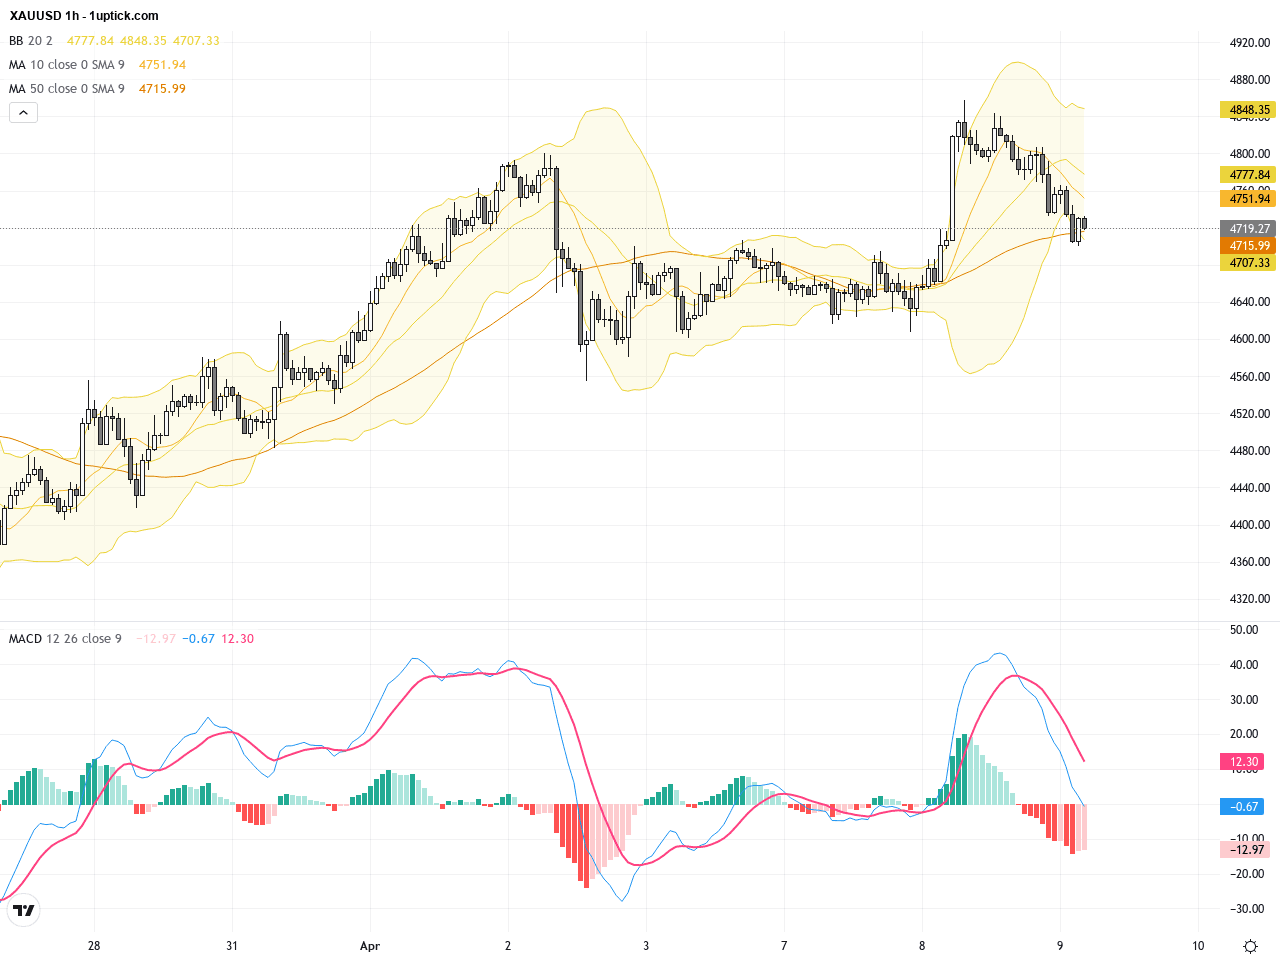
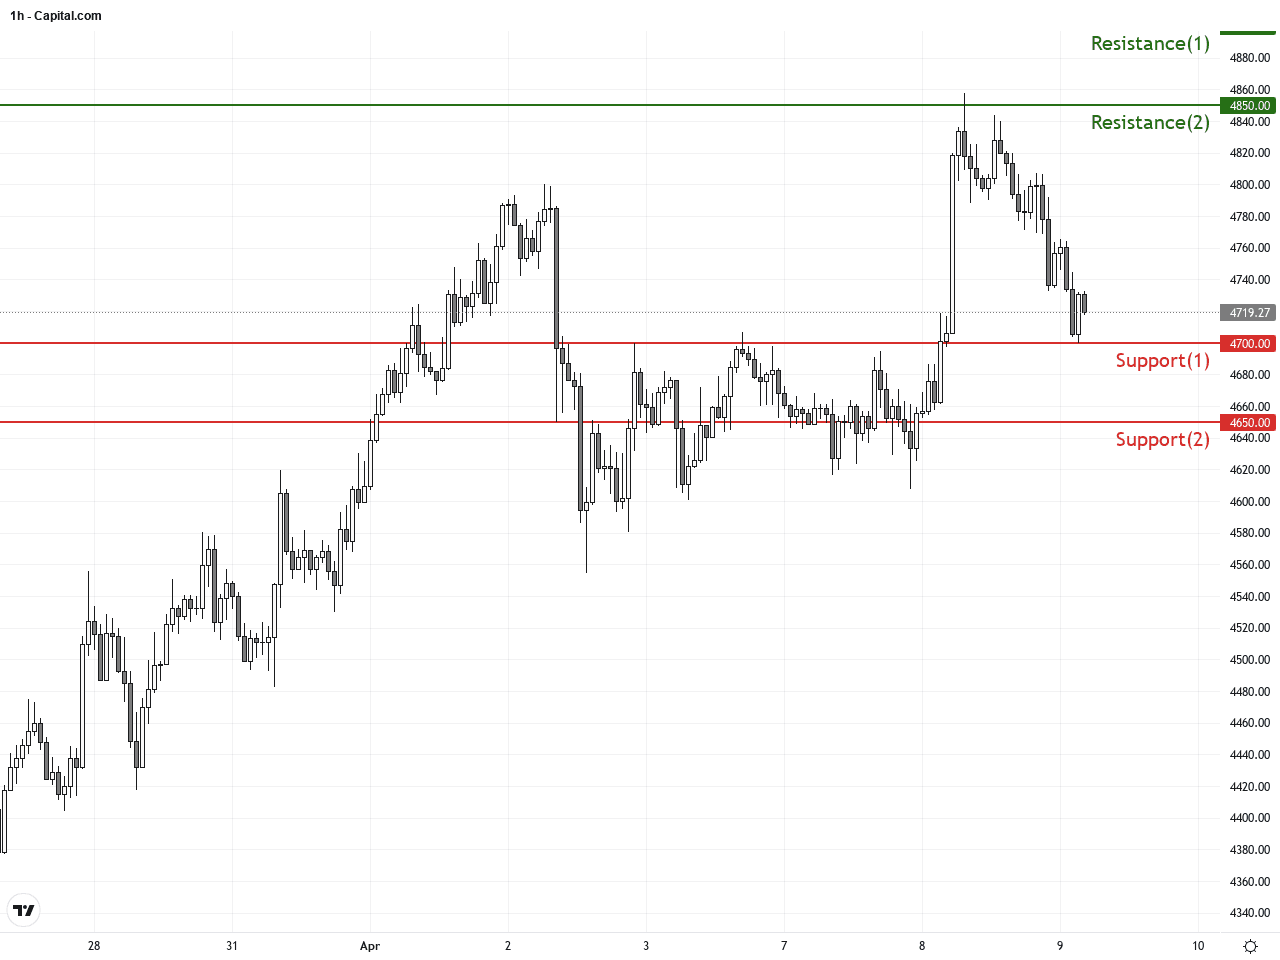
On the hourly chart over the last 3-5 days, price action shows increased volatility with a sharp rally from April 7 to April 8 followed by sideways consolidation. Short-term moving averages demonstrate a bullish crossover supporting the upward momentum. Bollinger Band width expansion confirms heightened intraday volatility. A hammer candlestick formed on the afternoon of April 8, signaling rejection of lower prices and suggesting a potential short-term bounce.
Technical Trend: XAUUSD currently exhibits a cautiously bullish trend, with medium-term upside potential tempered by near-term consolidation and risk of pullback.
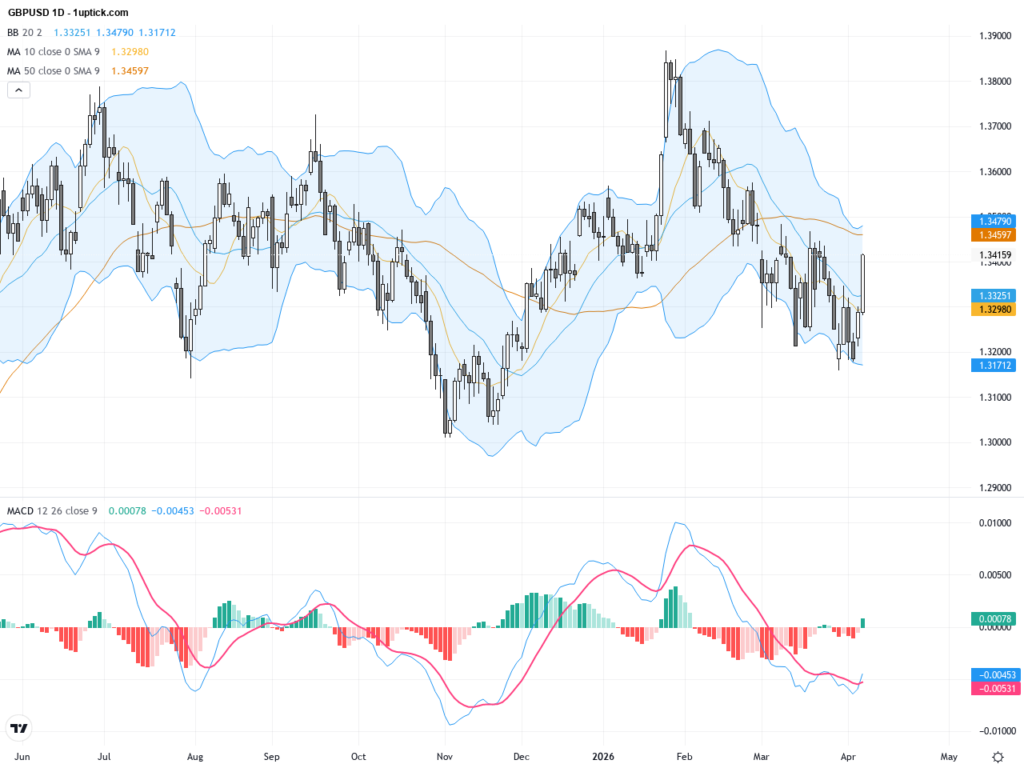
Technically, XAUUSD is at a crossroads with a medium-term bullish structure but short-term caution warranted due to a forming head and shoulders pattern near the 4900 resistance. While daily MACD shows signs of momentum fading, the hourly hammer candle suggests short-term buying interest remains intact. Traders should monitor these contradictory signals closely and watch key price levels and fundamental news to confirm any breakout or reversal.Today’s GMT+1 calendar reveals no major events directly impacting gold (XAUUSD). However, Japan’s February current account surplus surged beyond expectations, which may influence JPY safe-haven flows affecting gold indirectly. European producer price and retail sales data came in weaker than forecasts, potentially pressuring the euro and strengthening the dollar, adding downward pressure on gold prices. Later, the US FOMC minutes release carries the potential to create significant USD volatility, which in turn could impact gold prices.
Resistance & Support
The above financial market data, quotes, charts, statistics, exchange rates, news, research, analysis, buy or sell ratings, financial education, and other information are for reference only. Before making any trades based on this information, you should consult independent professional advice to verify pricing data or obtain more detailed market information. 1uptick.com should not be regarded as soliciting any subscriber or visitor to execute any trade. You are solely responsible for all of your own trading decisions.