


 |
| Gold V.1.3.1 signal Telegram Channel (English) |
XAUUSD Technical Breakout Amid Middle East Tensions: Gold Trading Outlook Explained
2026-04-07 @ 05:04
Over the past 24 to 48 hours, gold prices (XAUUSD) have experienced significant volatility, influenced by escalating Middle East geopolitical tensions and rising inflation risks. Gold closed at $4650.16 on April 6, 2026, slightly pulling back from prior gains as market dynamics reflect a mix of heightened risk aversion and uncertainty triggered by President Trump’s tough stance on Iran.
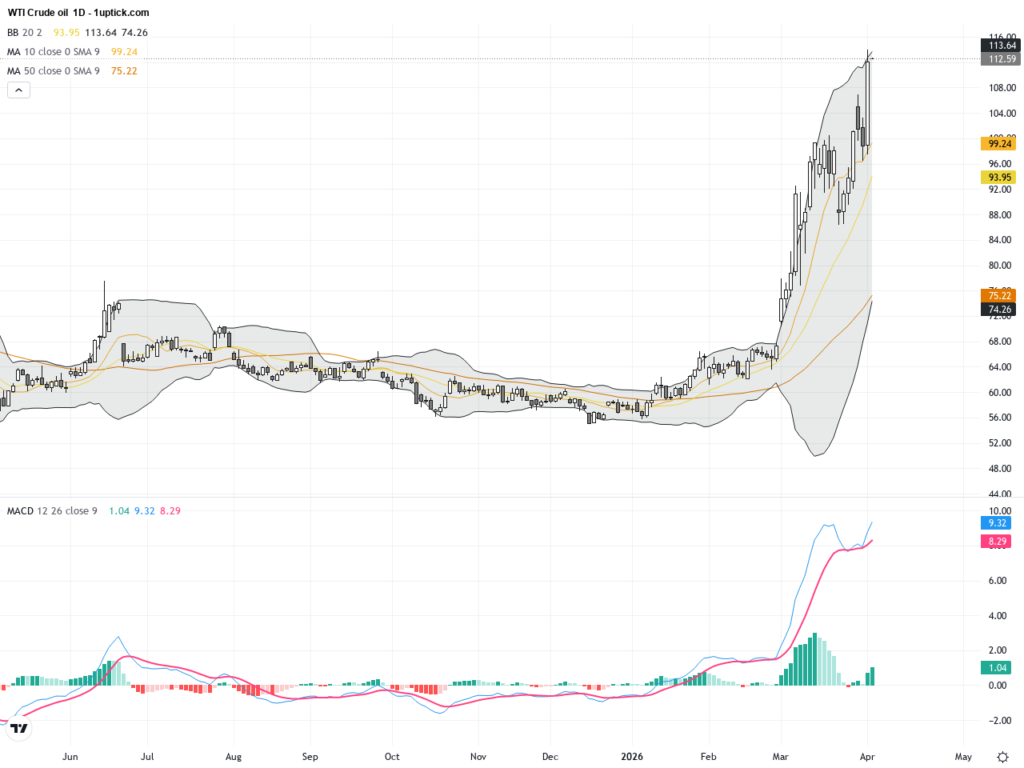
Recent market news highlights that Trump’s increased pressure on Iran briefly lifted gold prices, but a surge in oil prices fueling inflation concerns capped the breakout, causing gold to retreat. The gold/silver ratio stabilizing above 64 indicates diversified demand for safe-haven assets. For the average investor, this means recent gold moves are not just simple flights to safety but risk management amid intertwined geopolitical and inflation uncertainties. Investors should closely monitor Middle East developments and energy price trends, as these will have a direct impact on precious metals markets.
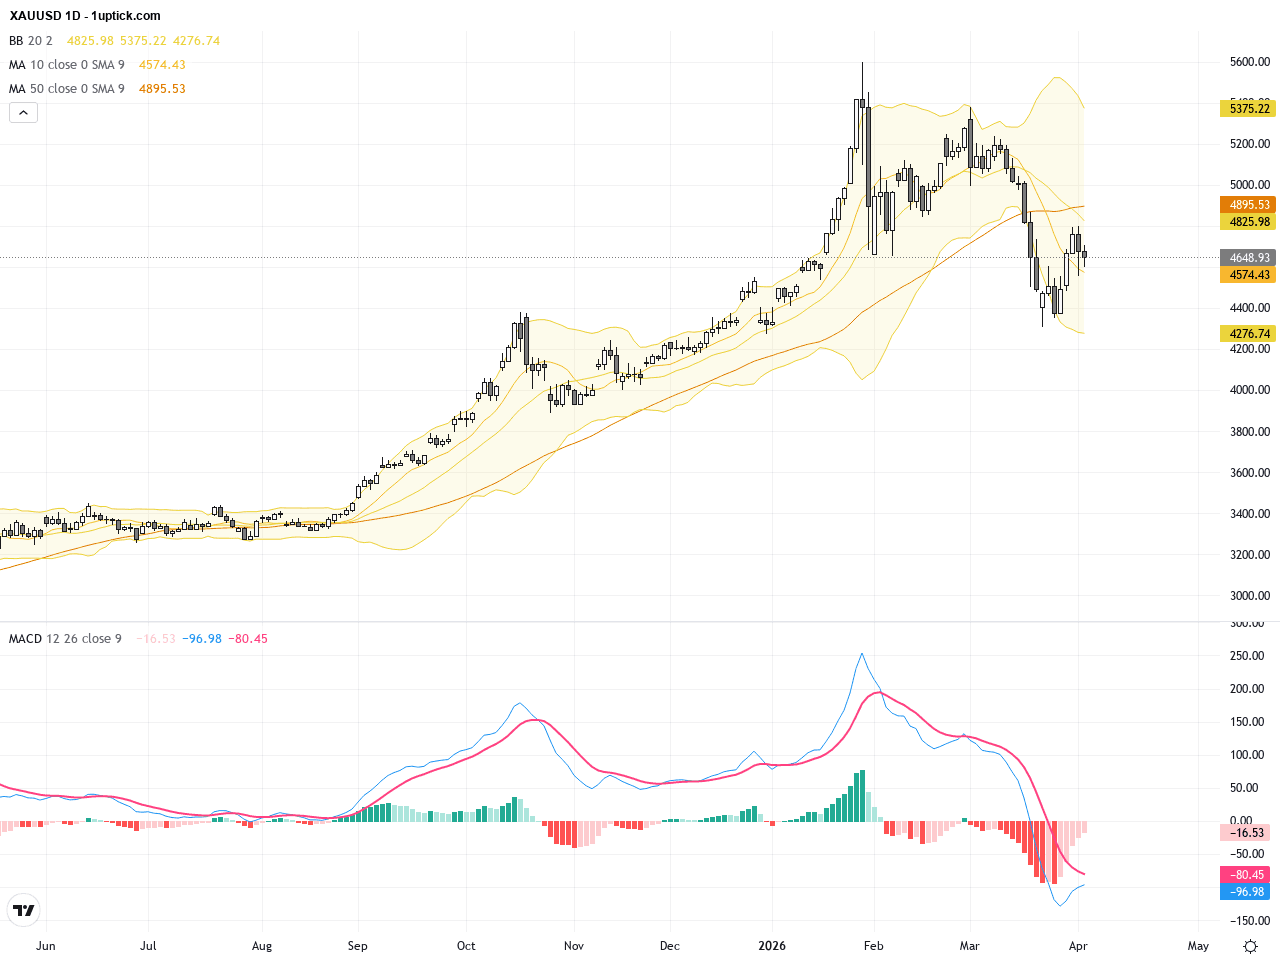
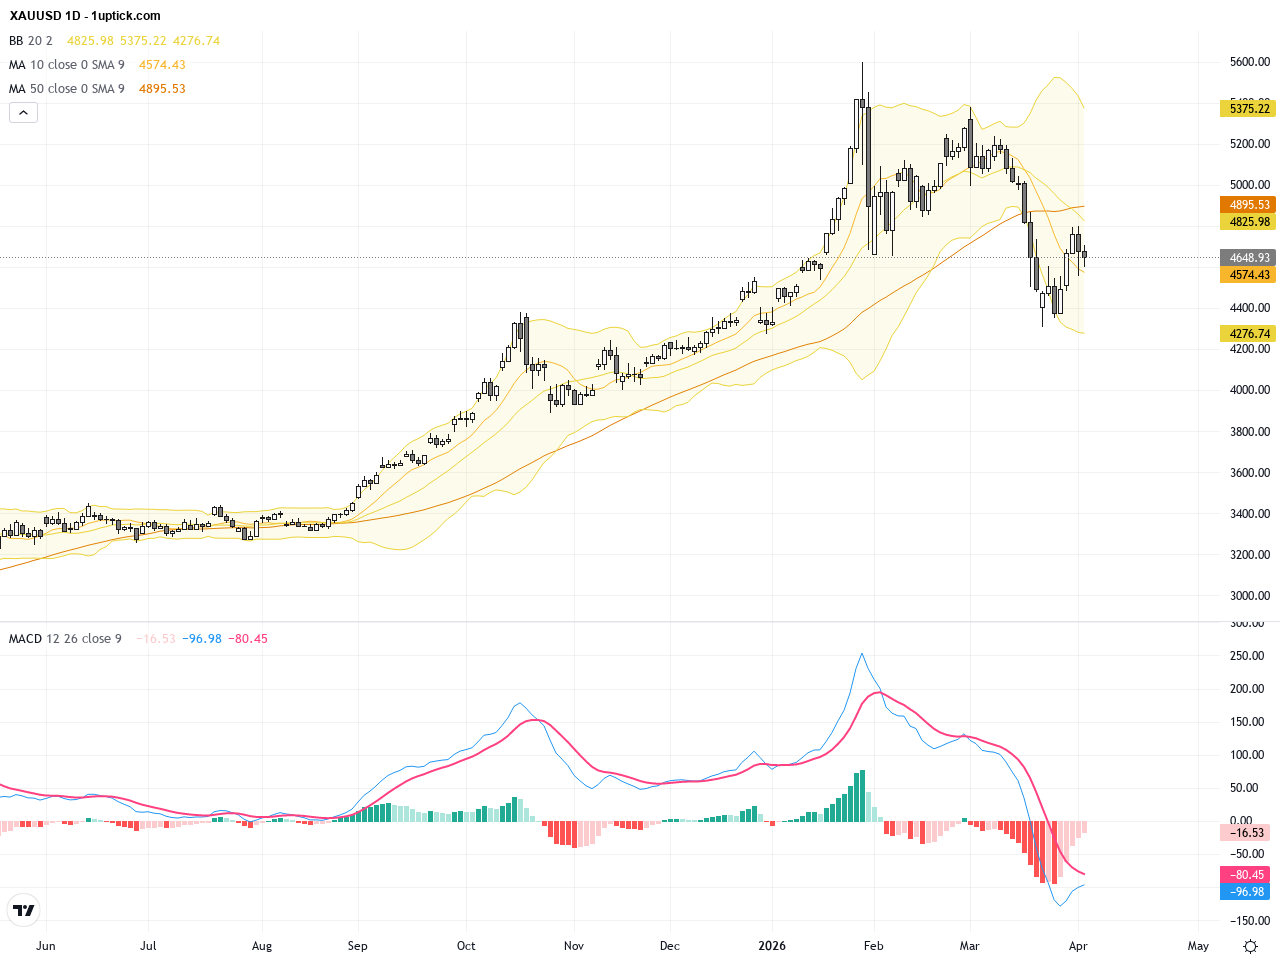
The daily chart shows XAUUSD in a clear downtrend over the past week, declining from a late March peak close to 4800 towards the 4650 range. Bollinger Bands have tightened indicating reduced volatility but no confirmed trend reversal. The MACD signals weakening momentum without forming a full bearish crossover yet, suggesting potential continued consolidation. The 200-day moving average remains above price, offering longer-term support but short-term downside risk persists.
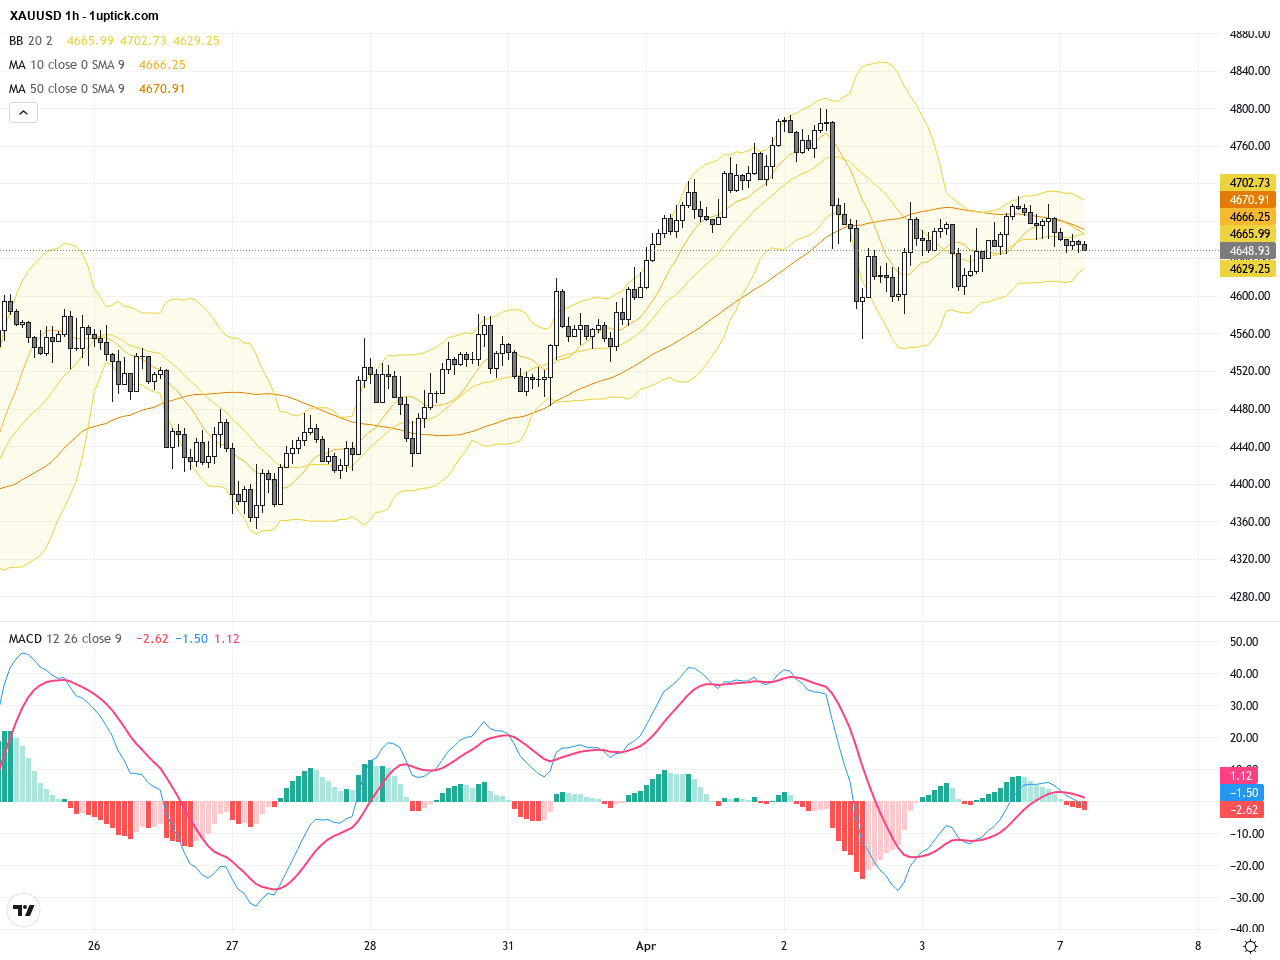
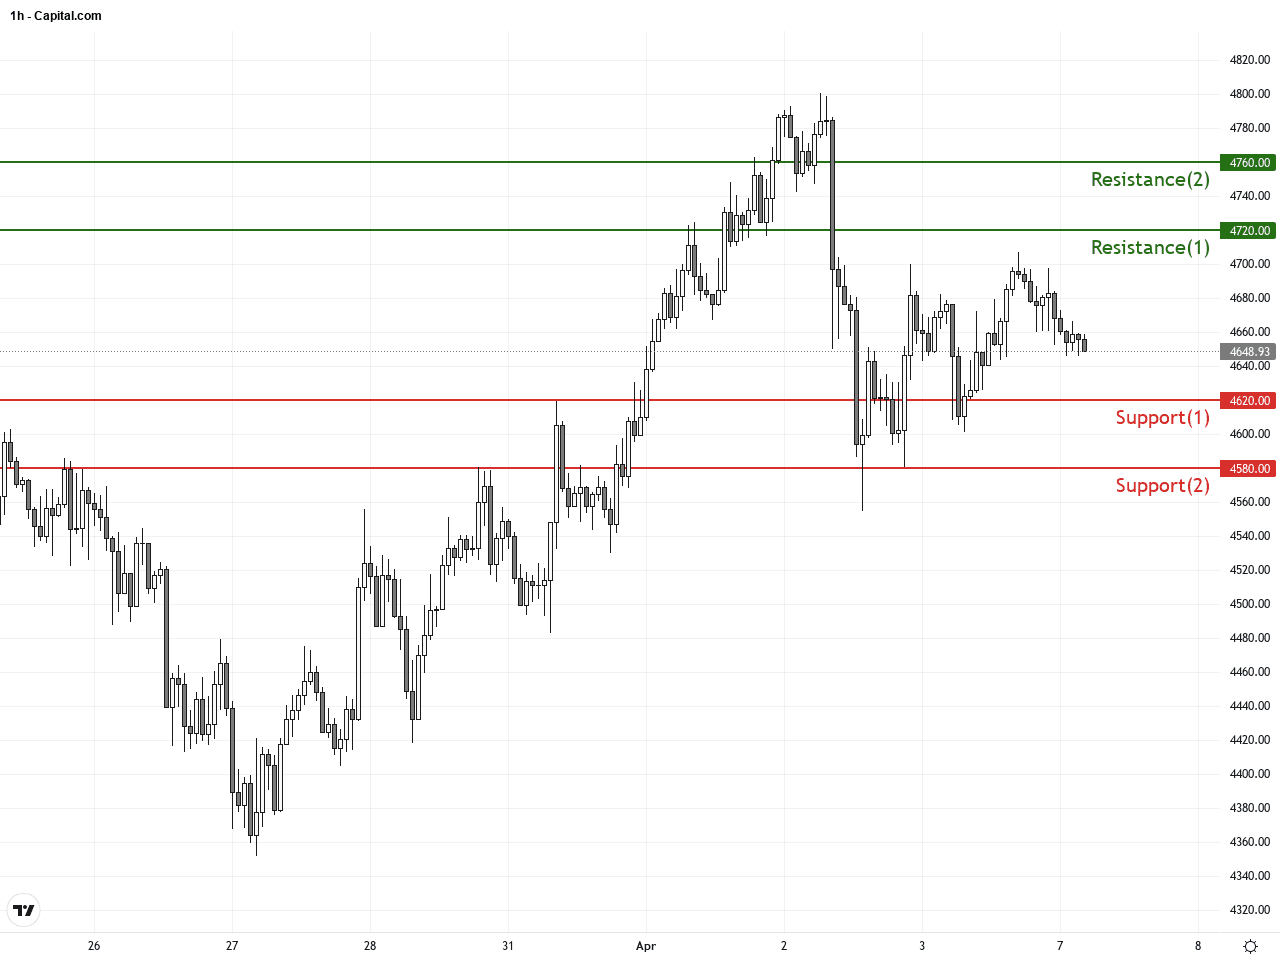
On the hourly chart spanning the last 3-5 days, XAUUSD has traded sideways between 4720 and 4600, consolidating in a range-bound pattern. The 20 and 50 EMAs are intertwined, and MACD hovers near the zero line, showing no clear momentum direction. A recent hammer candlestick suggests short-term buying interest, but failure to break above 4720 resistance risks falling back into the downtrend. Price action currently centers around the middle Bollinger Band, demanding close attention for breakout confirmation.
Technical Trend: Cautiously consolidating amid mixed technical and fundamental signals
Technically, XAUUSD is forming a short-term consolidation flag pattern, reflecting ongoing indecision. The formation of a hammer candlestick recently signals potential for a short-term rebound. The MACD remains bearish but a bullish crossover could trigger a significant buy signal. A decisive break above the 4720 resistance level is pivotal to extend the uptrend; failure to do so may shift momentum back to the bears.At 16:00 GMT+1 today, key US data releases including the ISM Non-Manufacturing Index and its subcomponents are scheduled. This data will likely impact XAUUSD trading. Expectations indicate a slight slowdown with the ISM index forecast at 55 down from 56.1. If results disappoint, it could weaken the USD and support gold prices; conversely, stronger-than-expected data may bolster the USD and pressure gold lower. Traders should monitor these releases closely from a Hong Kong time perspective in the evening.
Resistance & Support
The above financial market data, quotes, charts, statistics, exchange rates, news, research, analysis, buy or sell ratings, financial education, and other information are for reference only. Before making any trades based on this information, you should consult independent professional advice to verify pricing data or obtain more detailed market information. 1uptick.com should not be regarded as soliciting any subscriber or visitor to execute any trade. You are solely responsible for all of your own trading decisions.