 |
| Gold V.1.3.1 signal Telegram Channel (English) |

EURUSD: Key Support Emerges Amid US-Iran Tensions and Dollar Strength, May 18, 2026
2026-05-18 @ 09:01
Over the past 24 to 48 hours, the EUR/USD pair fluctuated between 1.1600 and 1.1625, closing slightly lower at 1.16121 compared to yesterday’s close of 1.16252. This volatility was primarily driven by escalating US-Iran tensions, which increased demand for the US dollar as a safe-haven asset, exerting downward pressure on the euro. Rising oil prices stoked fears of higher inflation, with US CPI data expected to show the highest jump since September 2023, further strengthening the dollar.
Recent weak US retail sales data briefly tempered dollar strength, but overall market expectations of continued Fed rate hikes pushed the US Dollar Index to a five-week high. This combination of geopolitical risk and dollar resilience led EUR/USD to decline approximately 1.5%. Market dynamics including equity rallies and safe-haven flows also contributed. For the average investor, this scenario illustrates how global uncertainty naturally boosts dollar demand as a haven, signaling the need for cautious currency asset management amid shifting geopolitical and inflation outlooks.
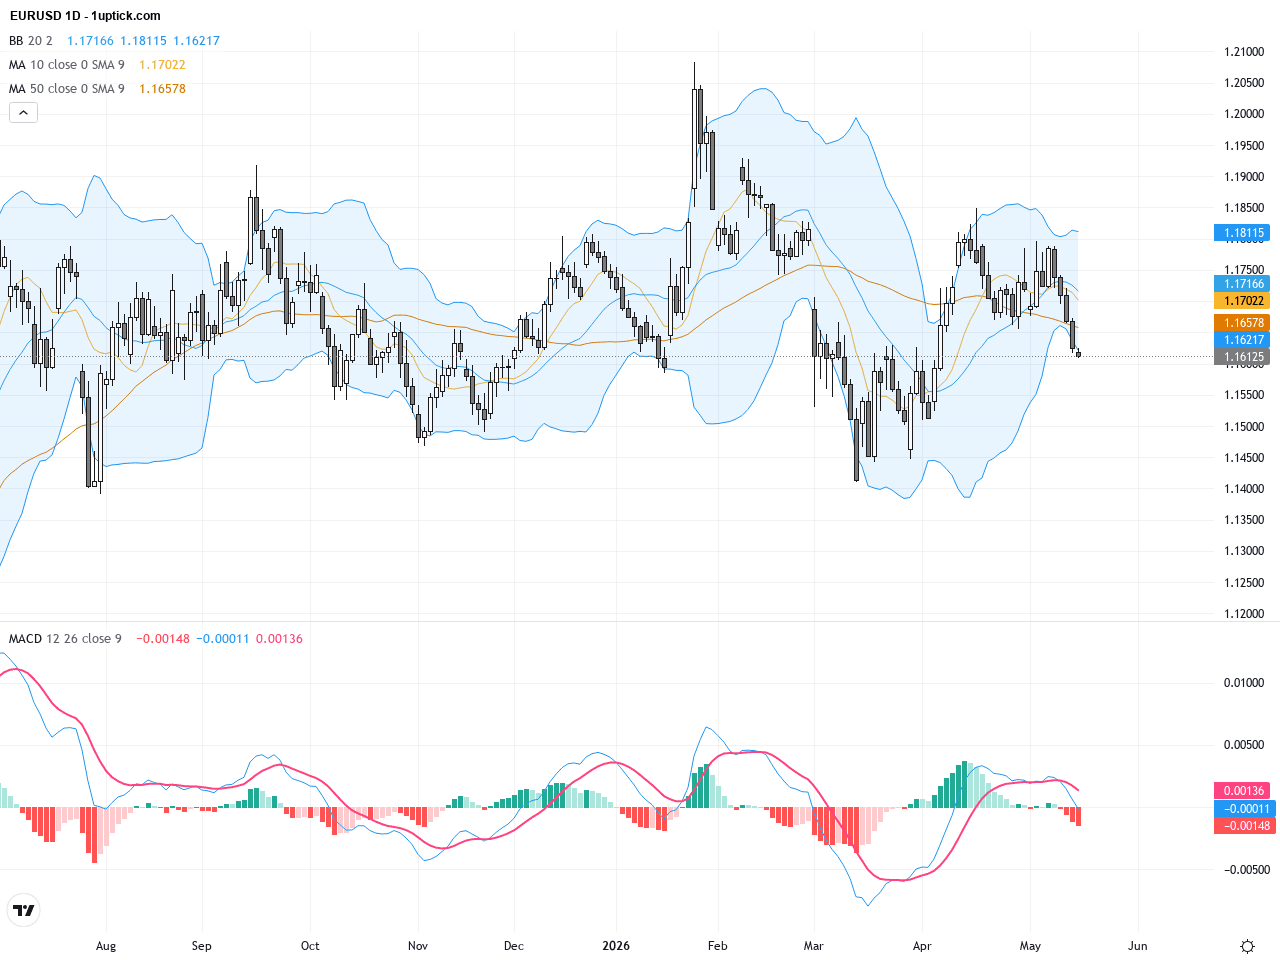
The daily chart reveals a clear downtrend for EURUSD since early 2026, with prices consistently pressured within the 1.167 to 1.208 range. The 50-day and 200-day moving averages stand at 1.1666 and 1.1678 respectively, with price action recently falling below both, indicating weakening bullish momentum. Bollinger Bands are narrowing and slanting downward, suggesting reduced volatility but sustained bearish bias. The MACD histogram is contracting with the fast line beneath the slow line, reaffirming medium-term bearish momentum still dominant.
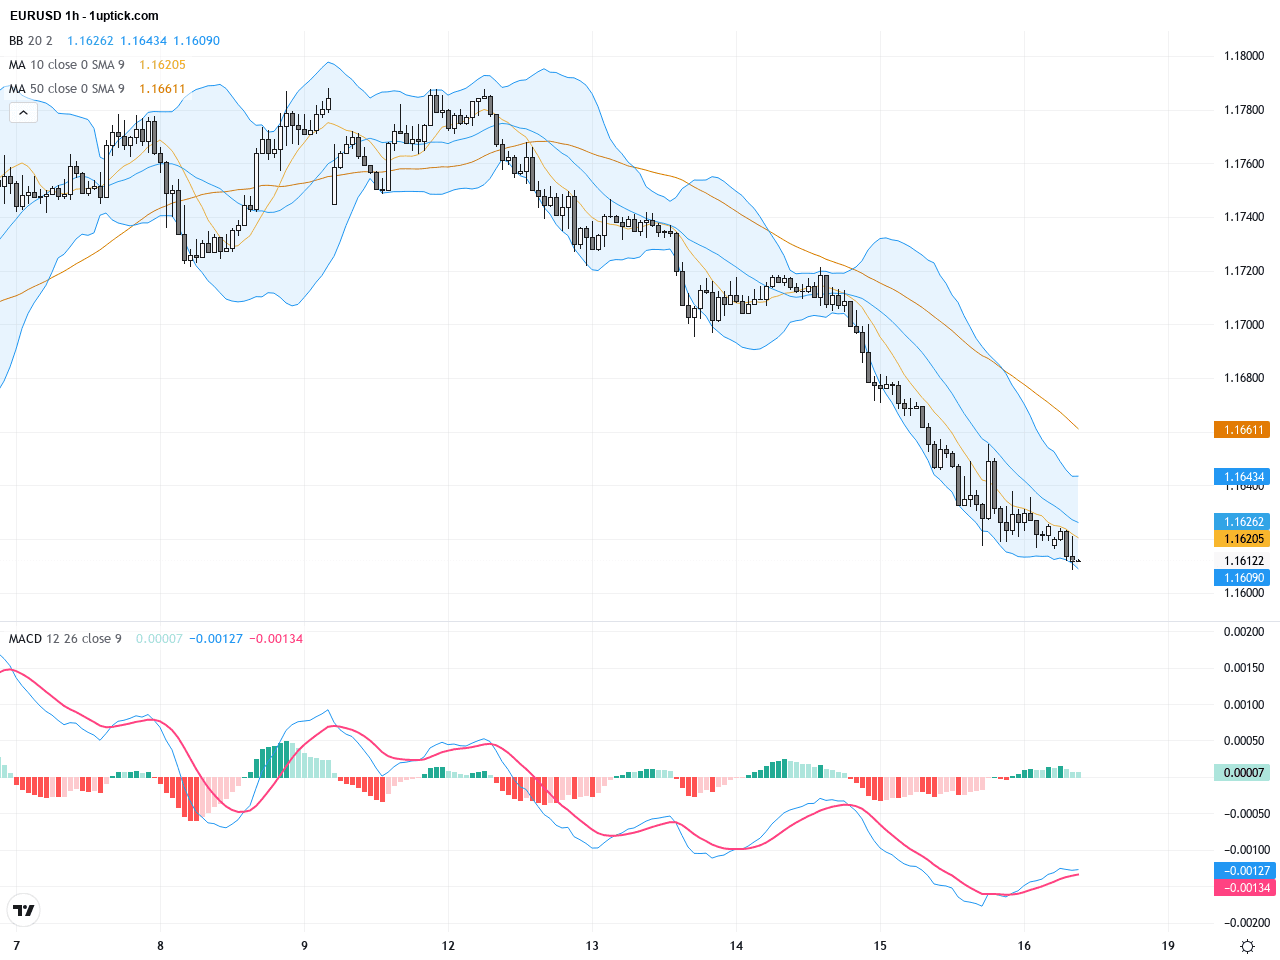
On the hourly chart, EURUSD has displayed pressured sideways movement over the last 3-5 days, oscillating between 1.1600 and 1.1660. Shorter moving averages are trending downward, with the 20-period SMA currently suppressing price, reflecting short-term bearish tone. The MACD shows a slight bearish crossover paired with RSI lingering in mid-lower range, signaling bearish momentum without an aggressive selloff. This consolidative phase warrants close watch for breakout signals to determine next directional move.
Technical Trend: EURUSD is currently in a cautiously bearish consolidation.
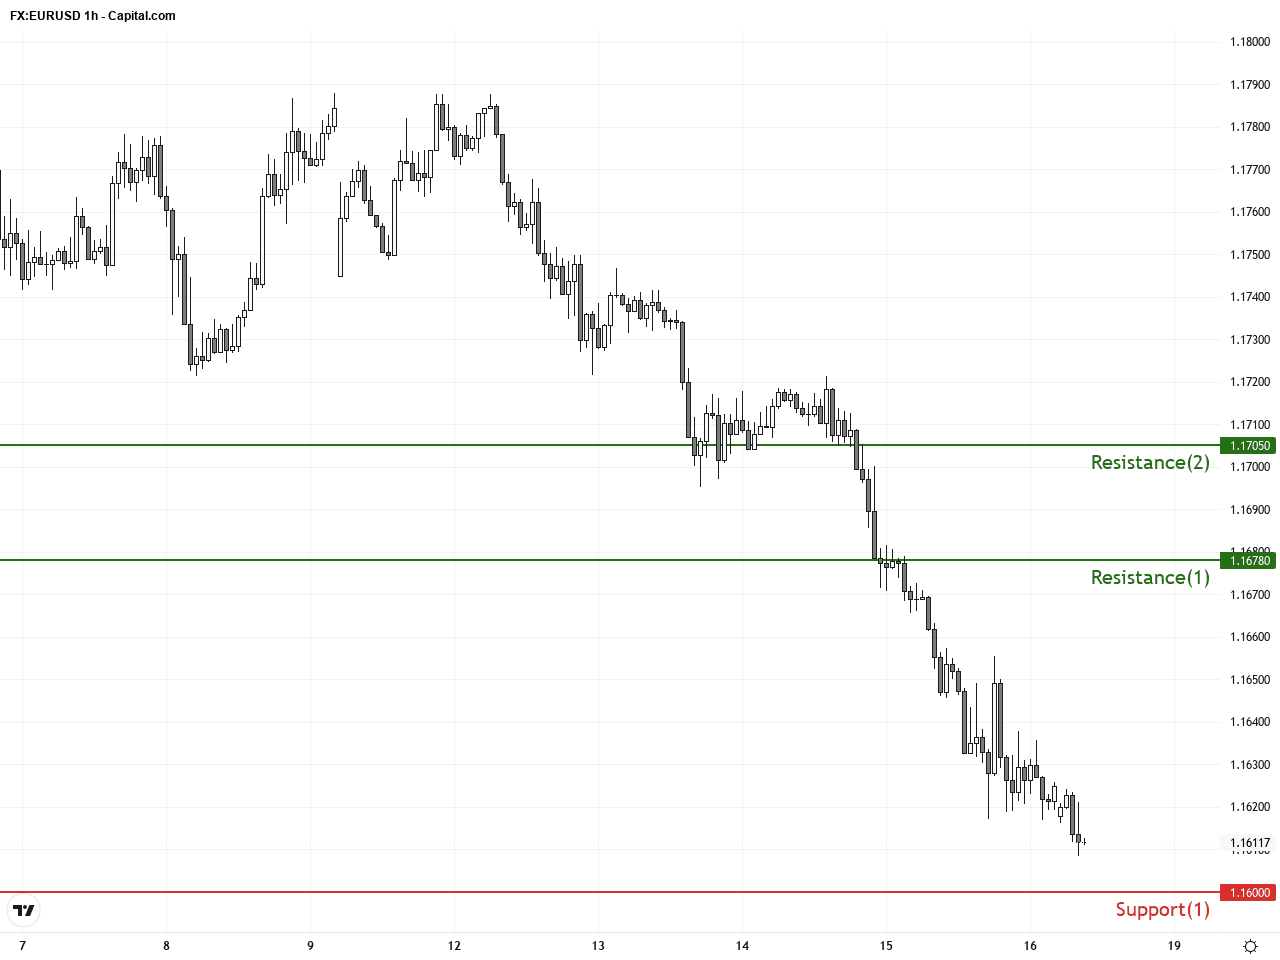
Technical analysis points to EURUSD holding a crucial support near 1.1600, where some buying interest has emerged. However, strong dollar rallies and geopolitical uncertainties continue to weigh on the pair. The MACD momentum remains bearish, while bullish candlestick signals such as engulfing or hammer patterns around this level could signal a near-term rebound. Traders should be cautious of a breakdown below support which may trigger further downside risk, emphasizing strict risk management.There are no significant or directly relevant economic events scheduled today that would impact EURUSD price action. Market focus remains on geopolitical developments and macro news flow affecting dollar strength and euro sentiment.
Resistance & Support
The above financial market data, quotes, charts, statistics, exchange rates, news, research, analysis, buy or sell ratings, financial education, and other information are for reference only. Before making any trades based on this information, you should consult independent professional advice to verify pricing data or obtain more detailed market information. 1uptick.com should not be regarded as soliciting any subscriber or visitor to execute any trade. You are solely responsible for all of your own trading decisions.