 |
| Gold V.1.3.1 signal Telegram Channel (English) |
XAUUSD Gold: Key Support and Rebound Potential Amid High Yields and Strong Dollar Pressure, May 22, 2026
2026-05-22 @ 05:04
Over the past 24 to 48 hours, gold (XAUUSD) experienced significant price fluctuations, moving around the May 21 closing price of 4540.265 USD. The market was pressured by rising U.S. Treasury yields and a stronger dollar, causing gold prices to test lower levels. Market attention turned to the surge in bond yields reaching new highs, which elevated the cost of holding gold. Meanwhile, a pullback in oil prices acted as a key catalyst for gold’s rebound from session lows.
Recent market news highlights three key forces shaping gold’s price movement as of May 21: climbing U.S. Treasury yields making gold less attractive; the strengthening dollar weighing on safe-haven demand; and easing oil prices mitigating inflation concerns, helping gold bounce back. Additionally, developments in the U.S.-Iran tensions initially spurred volatility but the hope for diplomatic resolutions eased worries over sustained inflation and interest rate hikes, offering short-term support to gold.
For everyday investors, this wave of gold price movement underscores that while gold’s traditional safe-haven appeal faces short-term headwinds from rising yields and a strong dollar, adjustments in oil markets and geopolitical thaw offer some respite. Investors should closely monitor Treasury yields and the dollar’s trajectory as these remain the primary drivers behind gold price fluctuations in the near term.
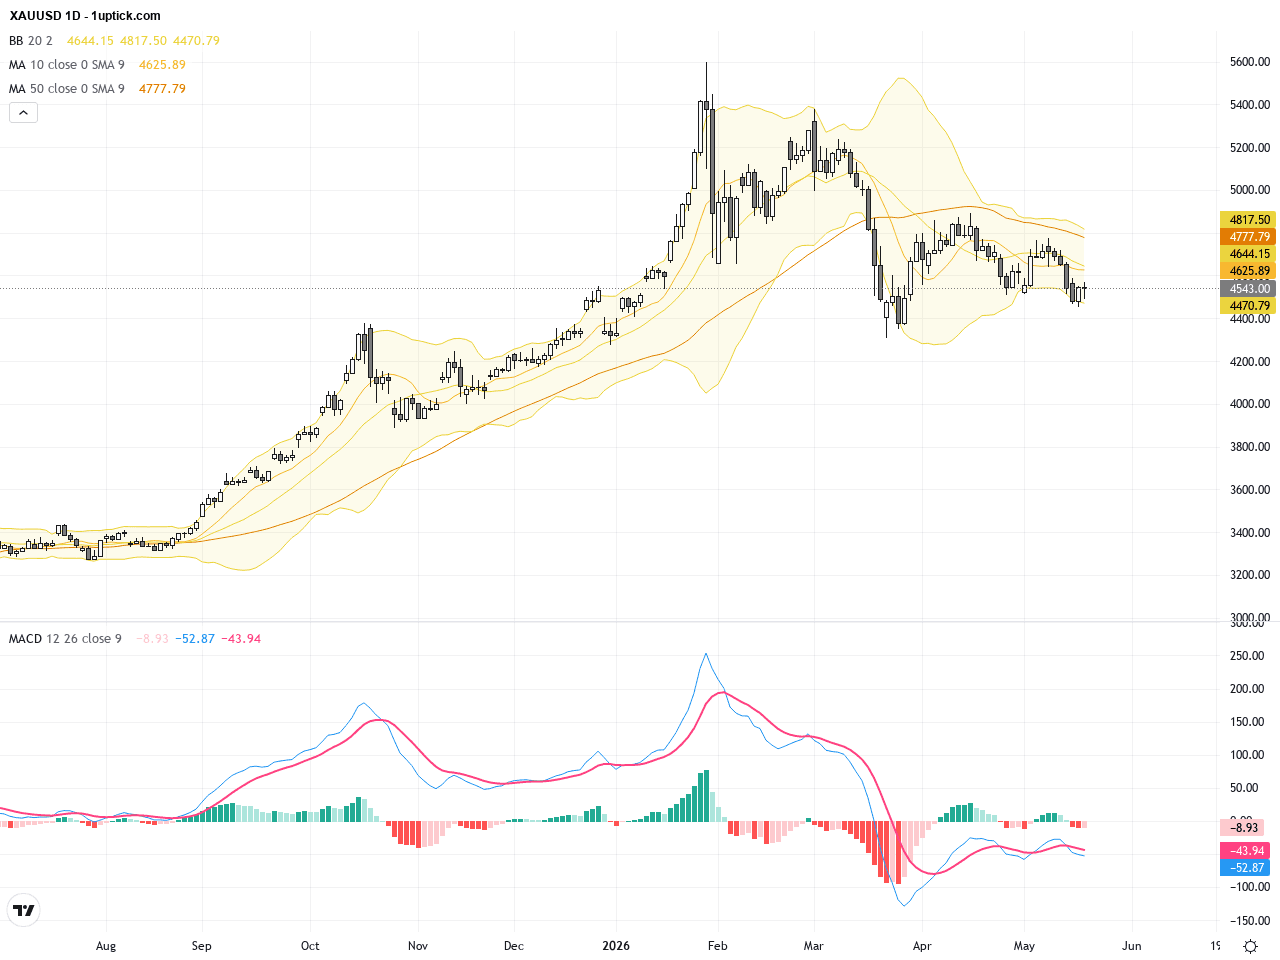
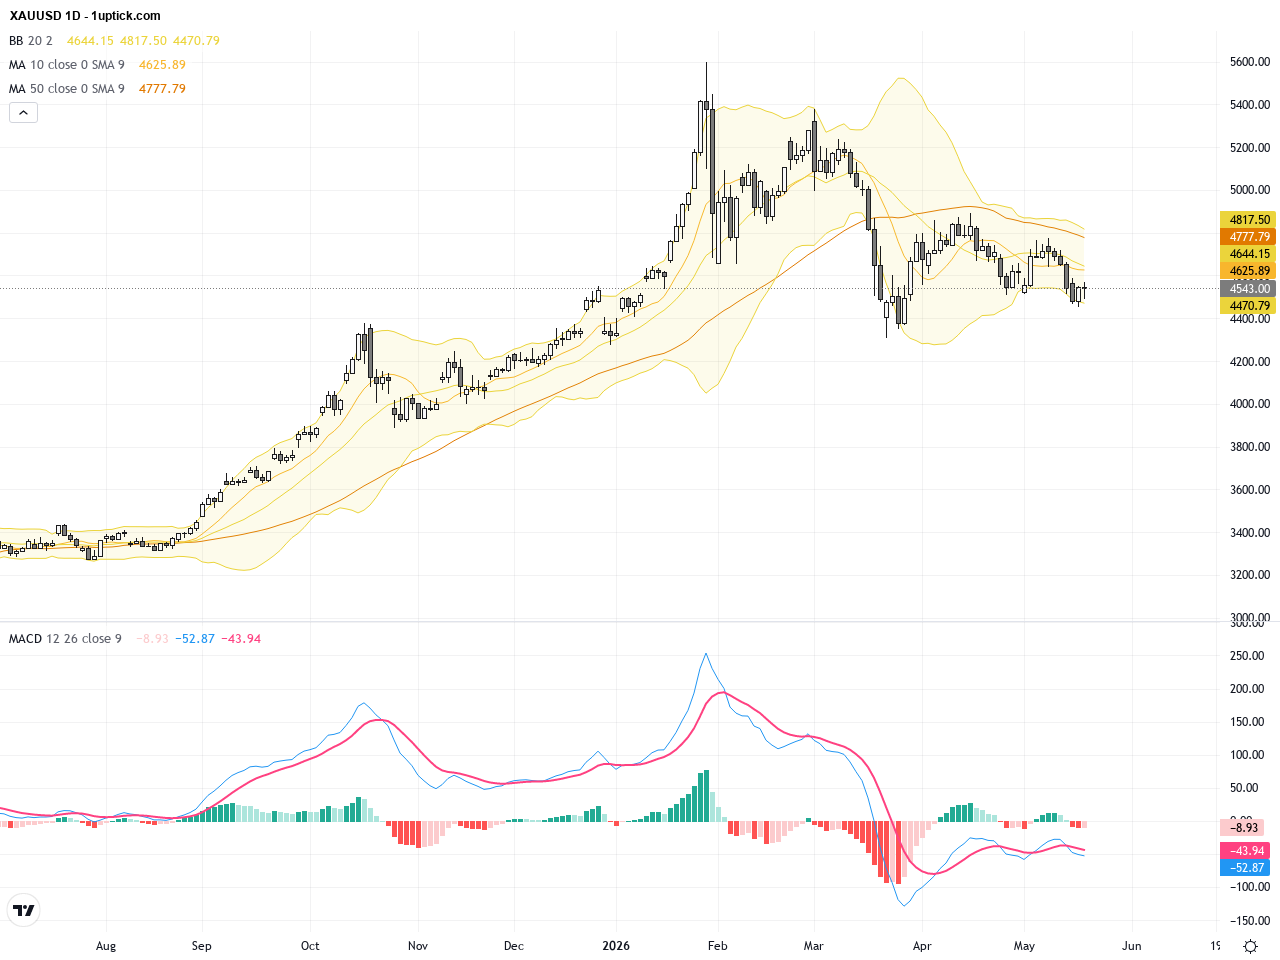
The XAUUSD daily chart shows a clear downtrend from recent highs, with gold testing and attempting to rebound from near a six-week low. The price remains below the 200-day moving average with expanding Bollinger Bands, indicating increased volatility. The MACD remains in negative territory but is converging, signaling a potential easing of selling pressure. A subtle double bottom pattern is visible, suggesting technical support but the overall trend remains bearish.
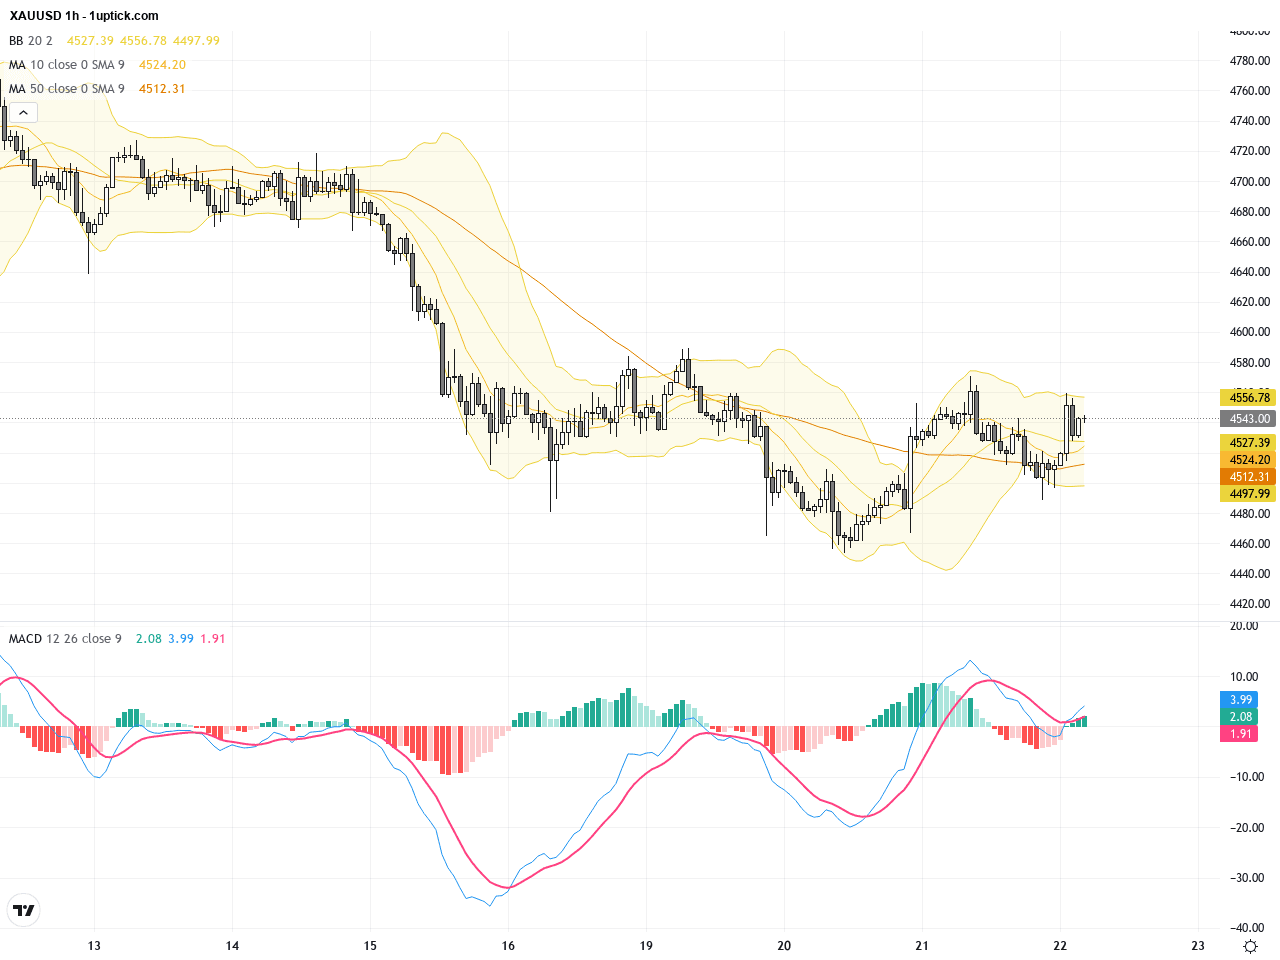
The hourly chart for XAUUSD reveals significant oscillation over the past 3-5 days, with price fluctuating between key support and resistance zones around 4400 to 4550. Moving averages (20 and 50 EMA) show a bullish crossover, and Bollinger Bands are contracting, indicating consolidation. The recent bullish engulfing candlestick pattern suggests positive momentum for the next 24 hours. Additionally, MACD lines have crossed bullishly, confirming a short-term upward push alongside steady volume.
Technical Trend: Current trend shows a cautiously bullish retracement within a broader consolidation phase.
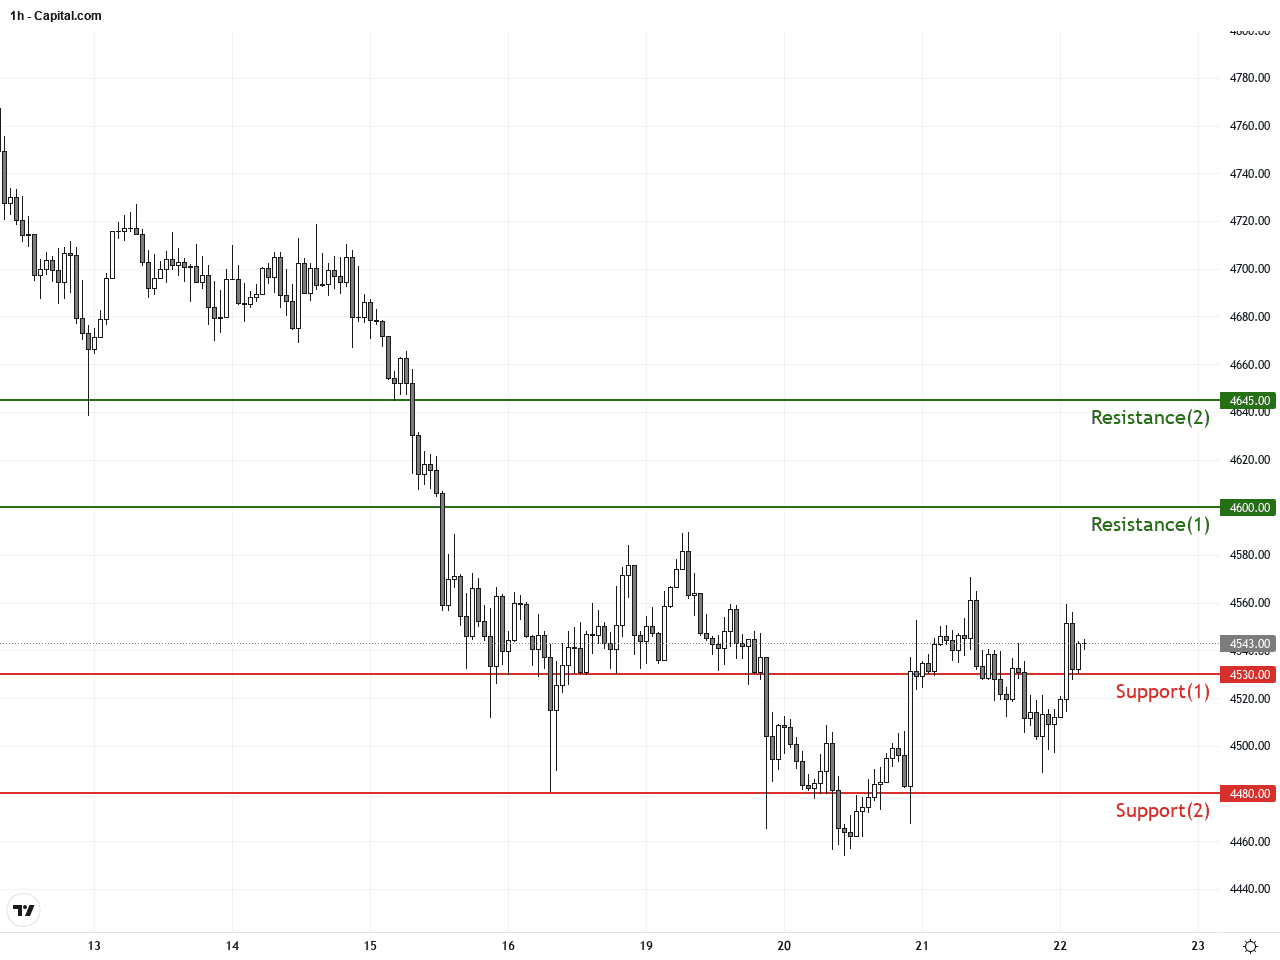
XAUUSD has been pressured by rising U.S. Treasury yields and a strong US dollar but received technical support from easing geopolitical tensions and lower oil prices. The daily chart displays a potential double bottom while the hourly chart presents a bullish engulfing candlestick, indicating short-term rebound potential. MACD bullish crossover on the hourly scale signals improving momentum. Key levels to watch include immediate support at 4530 and resistance near 4600. The mixed but improving technical patterns may signal a viable short-term trade opportunity.Today’s economic calendar holds no direct major events impacting XAUUSD. However, US Manufacturing and Services PMI releases at 14:30 and 15:45 (GMT+1) could influence the US dollar, subsequently affecting gold prices. Overall, there are no significant direct economic data that would cause immediate volatility in XAUUSD today. Traders should focus primarily on technical signals.
Resistance & Support
The above financial market data, quotes, charts, statistics, exchange rates, news, research, analysis, buy or sell ratings, financial education, and other information are for reference only. Before making any trades based on this information, you should consult independent professional advice to verify pricing data or obtain more detailed market information. 1uptick.com should not be regarded as soliciting any subscriber or visitor to execute any trade. You are solely responsible for all of your own trading decisions.