









 |
| Gold V.1.3.1 signal Telegram Channel (English) |
How to Construct a Cross-Asset Volatility & Correlation Framework to Size Leveraged Forex and Commodities Positions for Institutional-Grade Risk Parity Portfolios
2026-06-18 @ 00:06
Constructing a Cross-Asset Volatility & Correlation Framework for Risk Parity Position Sizing
In today’s interconnected global markets, institutional investors and sophisticated portfolio managers require a systematic approach to managing risk across diverse asset classes. This comprehensive guide provides a step-by-step methodology for constructing a professional-grade volatility and correlation framework specifically designed for sizing leveraged positions in forex and commodities within risk parity portfolios. Drawing from proven quantitative techniques used by leading hedge funds and asset managers, this framework ensures your portfolio maintains balanced risk contributions while maximizing risk-adjusted returns.
Step 1: Establish Your Cross-Asset Universe and Data Infrastructure
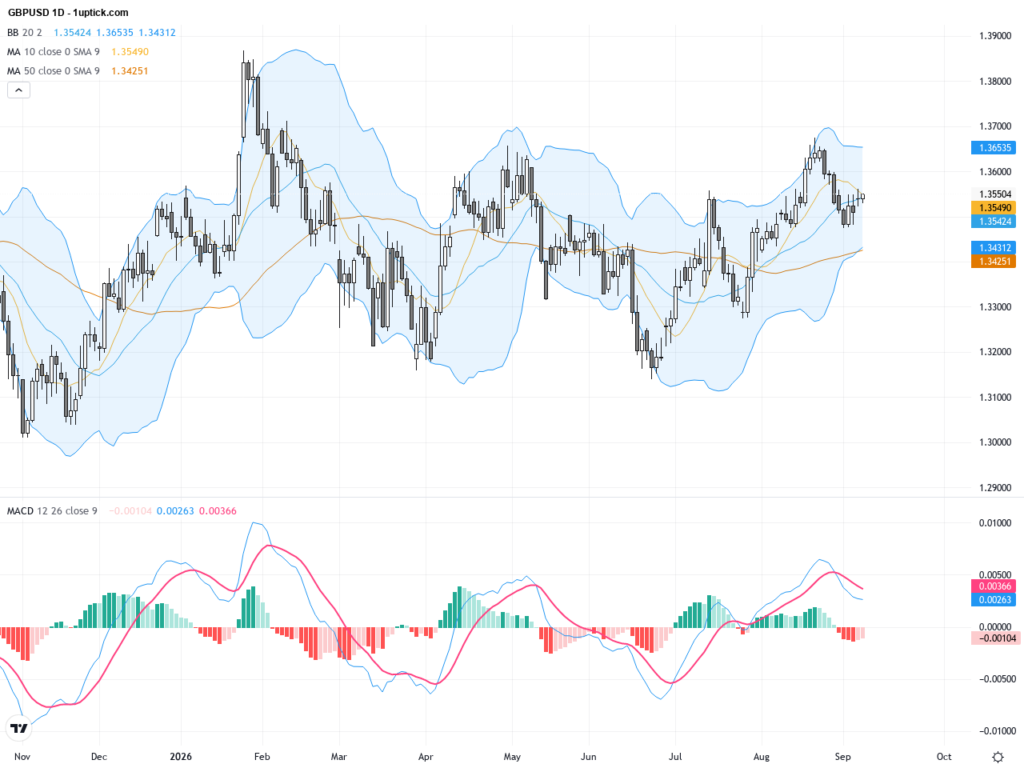
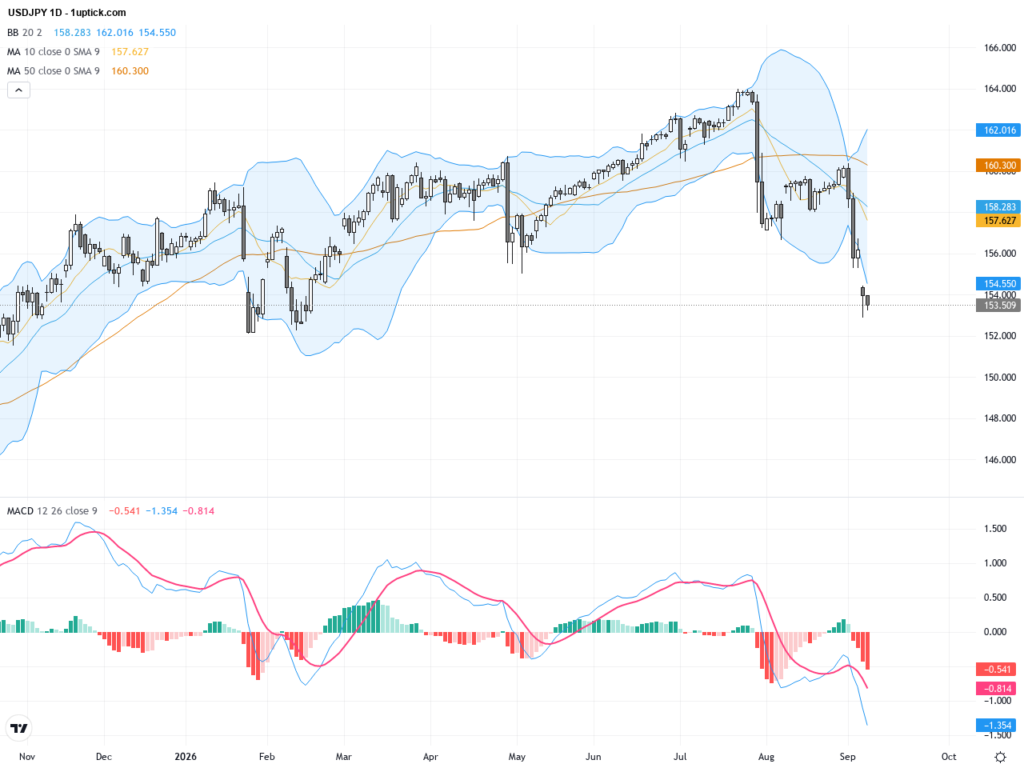
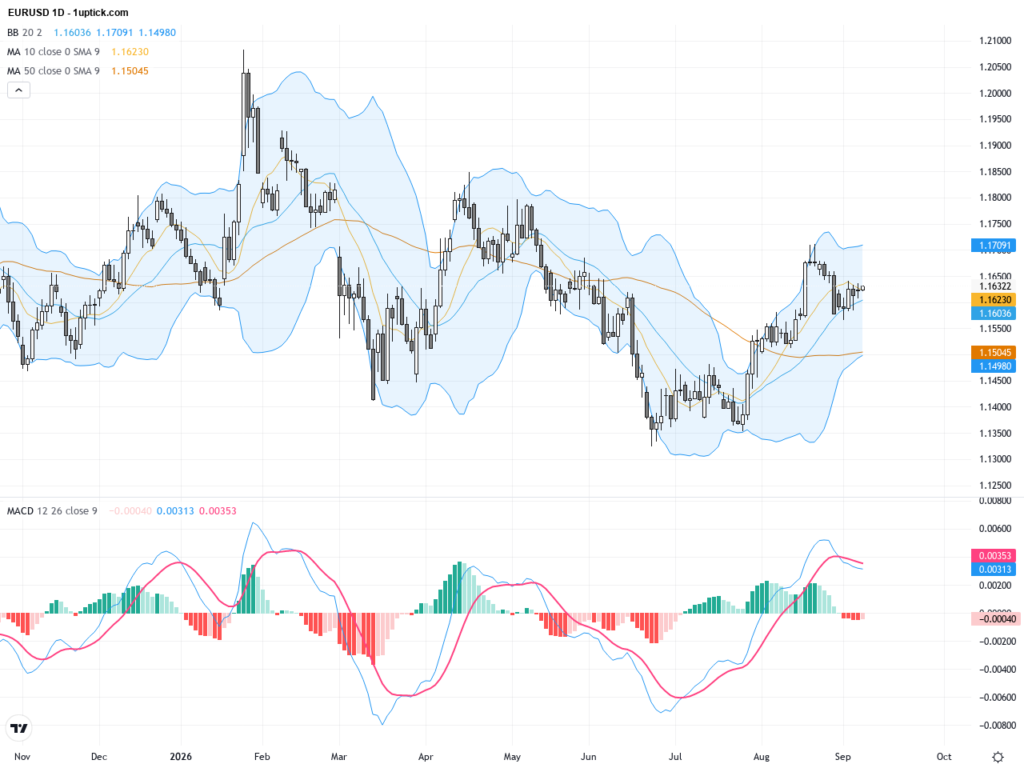
Begin by defining your investable universe across forex pairs and commodities. For institutional-grade analysis, include major currency pairs (EUR/USD, GBP/USD, USD/JPY, AUD/USD), commodity currencies (CAD, NOK, AUD), and key commodities (Gold, Crude Oil, Natural Gas, Copper, Silver). Implement a robust data pipeline that captures tick-level or minute-level price data from reliable sources such as Bloomberg, Reuters, or institutional-grade APIs. Ensure your infrastructure handles at least 5 years of historical data for meaningful statistical analysis, with real-time feeds for live portfolio management. Data quality checks including gap detection, outlier identification, and corporate action adjustments are essential for maintaining framework integrity.
Step 2: Calculate Rolling Realized Volatility Metrics
Implement multiple volatility estimation methodologies to capture different aspects of price behavior. Start with close-to-close volatility using logarithmic returns: σ = √(Σ(ri – r̄)² / (n-1)) × √252 for annualization. Incorporate Parkinson volatility using high-low ranges for more efficient estimation: σ_P = √(1/(4n×ln(2)) × Σln(Hi/Li)²) × √252. For comprehensive analysis, implement Garman-Klass or Yang-Zhang estimators that account for overnight gaps. Use rolling windows of 20, 60, and 120 days to capture short-term, medium-term, and structural volatility regimes. Weight recent observations more heavily using exponentially weighted moving averages (EWMA) with decay factors between 0.94-0.97.
Step 3: Construct Dynamic Correlation Matrices
Build correlation matrices using DCC-GARCH (Dynamic Conditional Correlation) models that capture time-varying relationships between assets. For a portfolio of n assets, calculate the standardized residuals from individual GARCH processes, then model the correlation dynamics: Qt = (1-α-β)Q̄ + α×εt-1×ε’t-1 + β×Qt-1. Implement shrinkage estimators (Ledoit-Wolf) to improve correlation matrix stability, particularly when the asset universe exceeds 20 instruments. Regularly test for correlation breakdown during stress periods by comparing rolling correlations against tail correlations (correlations computed only during extreme market moves). Maintain separate correlation regimes for risk-on and risk-off market environments.
Step 4: Implement the Risk Parity Allocation Algorithm
The core risk parity principle equalizes risk contribution from each asset: RCi = wi × (Σw)i / σp, where each asset contributes equally to total portfolio risk. For leveraged forex and commodities portfolios, solve the optimization problem: minimize Σ(RCi – RC_target)² subject to Σwi = 1 and leverage constraints. Implement the Naive Risk Parity approach (1/σi weighting) as a baseline, then advance to Equal Risk Contribution (ERC) using Newton-Raphson or Sequential Quadratic Programming solvers. Account for the fact that forex positions are inherently leveraged through margin requirements, typically 2-5% for majors, requiring careful gross exposure management.
Step 5: Develop Leverage-Adjusted Position Sizing Models
Create a position sizing framework that accounts for leverage constraints and margin requirements. Calculate the maximum position size as: Max_Position = (Risk_Budget × Portfolio_NAV) / (Asset_Volatility × Leverage_Factor × Margin_Requirement). Implement a tiered leverage system where leverage decreases as volatility increases: Effective_Leverage = Base_Leverage × (Target_Vol / Realized_Vol), capped at regulatory maximums. For commodities futures, account for contract specifications, roll costs, and margin requirements that differ significantly across products. Build in automatic deleveraging triggers when portfolio VaR exceeds predetermined thresholds (typically 95% VaR not exceeding 2% of NAV daily).
Step 6: Integrate Stress Testing and Scenario Analysis
Develop a comprehensive stress testing module that examines portfolio behavior under historical crisis scenarios (2008 Financial Crisis, 2015 CHF Flash Crash, 2020 Oil Negative Prices, 2022 Rate Shock) and hypothetical scenarios (200bp rate shock, 30% commodity spike, correlation breakdown to 0.8 across all assets). Calculate Conditional VaR (Expected Shortfall) at 95% and 99% confidence levels. Implement Monte Carlo simulations with regime-switching models to generate forward-looking risk distributions. Test margin call scenarios by modeling maximum adverse excursion and ensuring sufficient liquidity buffers (minimum 50% excess margin recommended).
Step 7: Build Real-Time Monitoring and Rebalancing Protocols
Establish systematic rebalancing triggers based on risk drift rather than calendar schedules. Rebalance when any asset’s risk contribution deviates more than 20% from target, when portfolio volatility exceeds target by 15%, or when correlation matrix eigenvalues indicate regime change. Implement intraday monitoring dashboards displaying current vs. target risk contributions, margin utilization, Greeks exposures for options overlays, and liquidity metrics. Build automated alert systems for correlation spikes, volatility regime changes, and approaching margin thresholds. Document all rebalancing decisions for regulatory compliance and performance attribution.
Step 8: Establish Governance and Performance Attribution Framework
Create a robust governance structure with clearly defined risk limits, escalation procedures, and model validation protocols. Implement performance attribution that decomposes returns into: asset allocation effect, volatility timing effect, correlation timing effect, and leverage effect. Conduct monthly model backtesting comparing predicted vs. realized volatilities and correlations. Establish a model risk committee that reviews framework assumptions quarterly and validates against out-of-sample data. Maintain detailed documentation meeting institutional standards (AIFMD, MiFID II, or relevant regulatory requirements).
Insider Insight from Industry Practitioners:
The most sophisticated institutional investors recognize that the volatility-correlation framework is only as good as its weakest assumption. In practice, correlations are highly unstable and tend to spike precisely when diversification is most needed. Leading risk parity practitioners implement ‘correlation of correlations’ monitoring—tracking how stable correlation relationships are over time—and increase cash buffers when correlation stability deteriorates. Additionally, the leverage applied in risk parity strategies means that small model errors compound significantly; therefore, conservative volatility forecasts (scaling realized vol by 1.1-1.2x) and correlation stress adjustments (shifting correlations 20% toward 1.0) provide crucial safety margins. Finally, liquidity risk is often underestimated: ensure your position sizing accounts for the fact that exit costs during stress periods can be 5-10x normal bid-ask spreads, particularly in commodity markets approaching delivery dates.