 |
| Gold V.1.3.1 signal Telegram Channel (English) |
XAUUSD: Key Resistance and Support Levels Amid Multi-Month Low Test in Gold Trading Outlook, June 25, 2026
2026-06-25 @ 05:04
Over the past 24 to 48 hours, gold prices have continued their downward trend, testing multi-month lows and closing at 3997.735 USD on June 24, 2026, a clear drop from 4110.745 USD the day before. This selling pressure mainly stems from a shift in global gold market sentiment alongside Deutsche Bank’s 22% cut in gold price forecasts, reflecting rising skepticism on Wall Street about gold’s peak. Meanwhile, despite a more than 3% decline in oil prices and increased traffic through the Strait of Hormuz, these energy market developments failed to support gold, indicating investors’ reduced anxiety over inflation and geopolitical risks.
For the average investor, this pullback in gold prices resembles a sudden surge in selling in what is usually a safe-haven asset market, driving prices lower. Investors may now reconsider gold’s role in their portfolio, pondering over potential asset reallocation or waiting for clearer trends. Additionally, market prediction platforms show slim odds of gold breaking above $4200 by the end of June 2026, with consensus suggesting that prices will likely consolidate near $4000 in the near term.
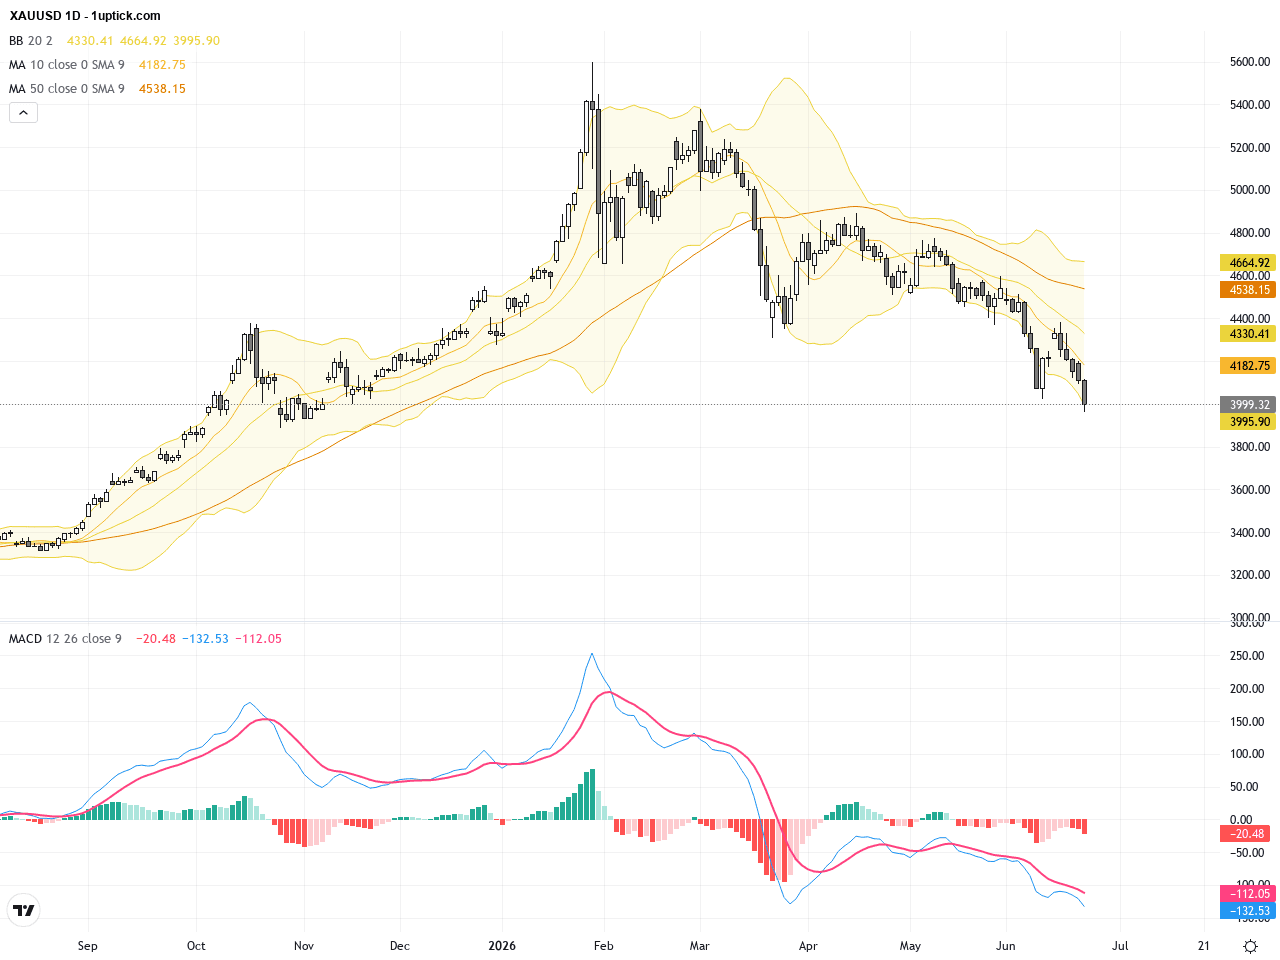
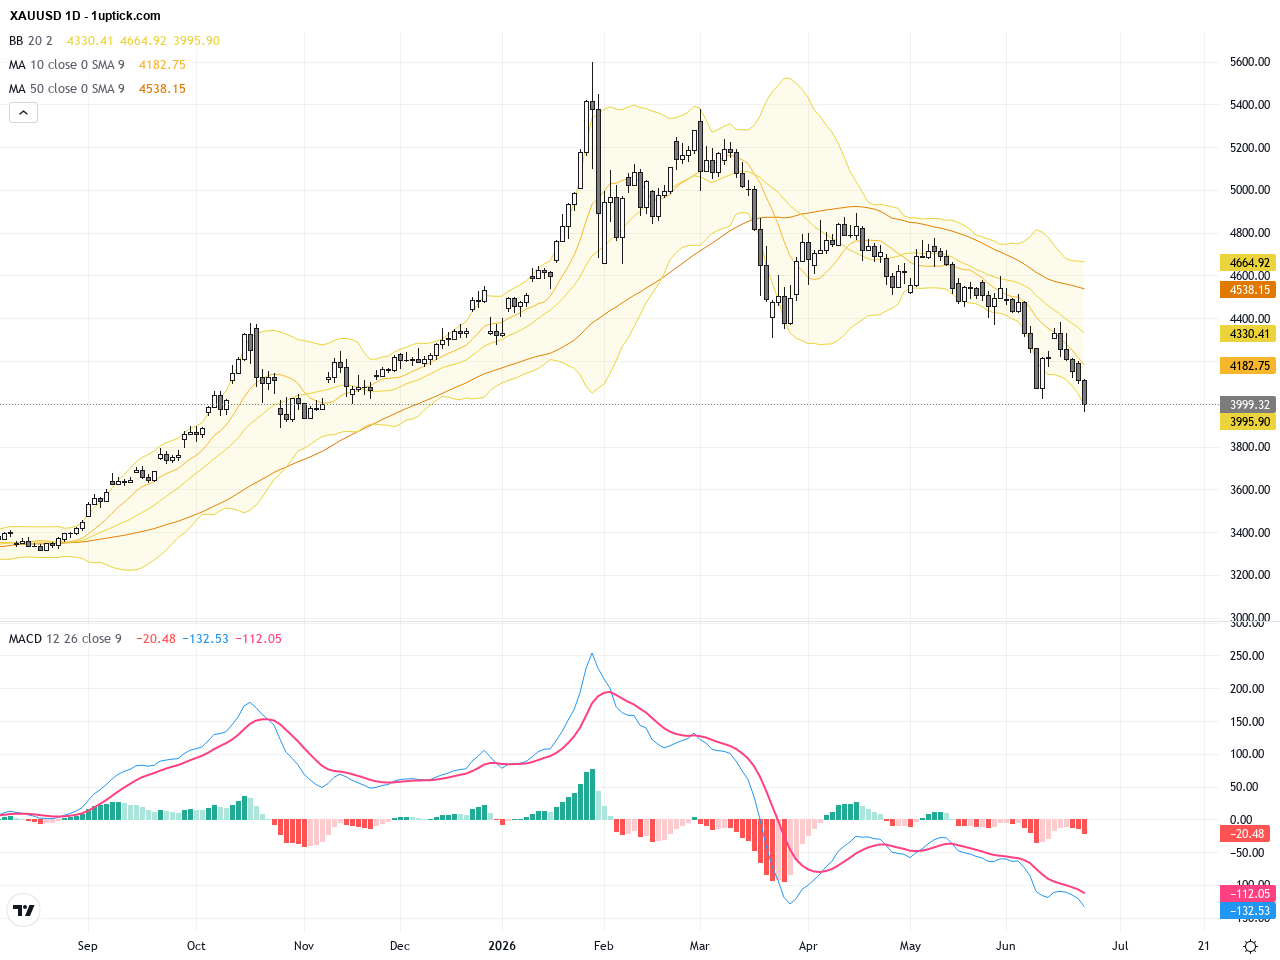
The daily chart reveals a long-term downtrend since the start of the year, with the past three days marking a steep decline breaking below several key moving averages and the middle Bollinger Band. The MACD indicator confirms bearish momentum with diverging moving average lines pointing downward. This technical setup suggests that bears remain in control, and prices may test previous lows unless a clear reversal pattern emerges.
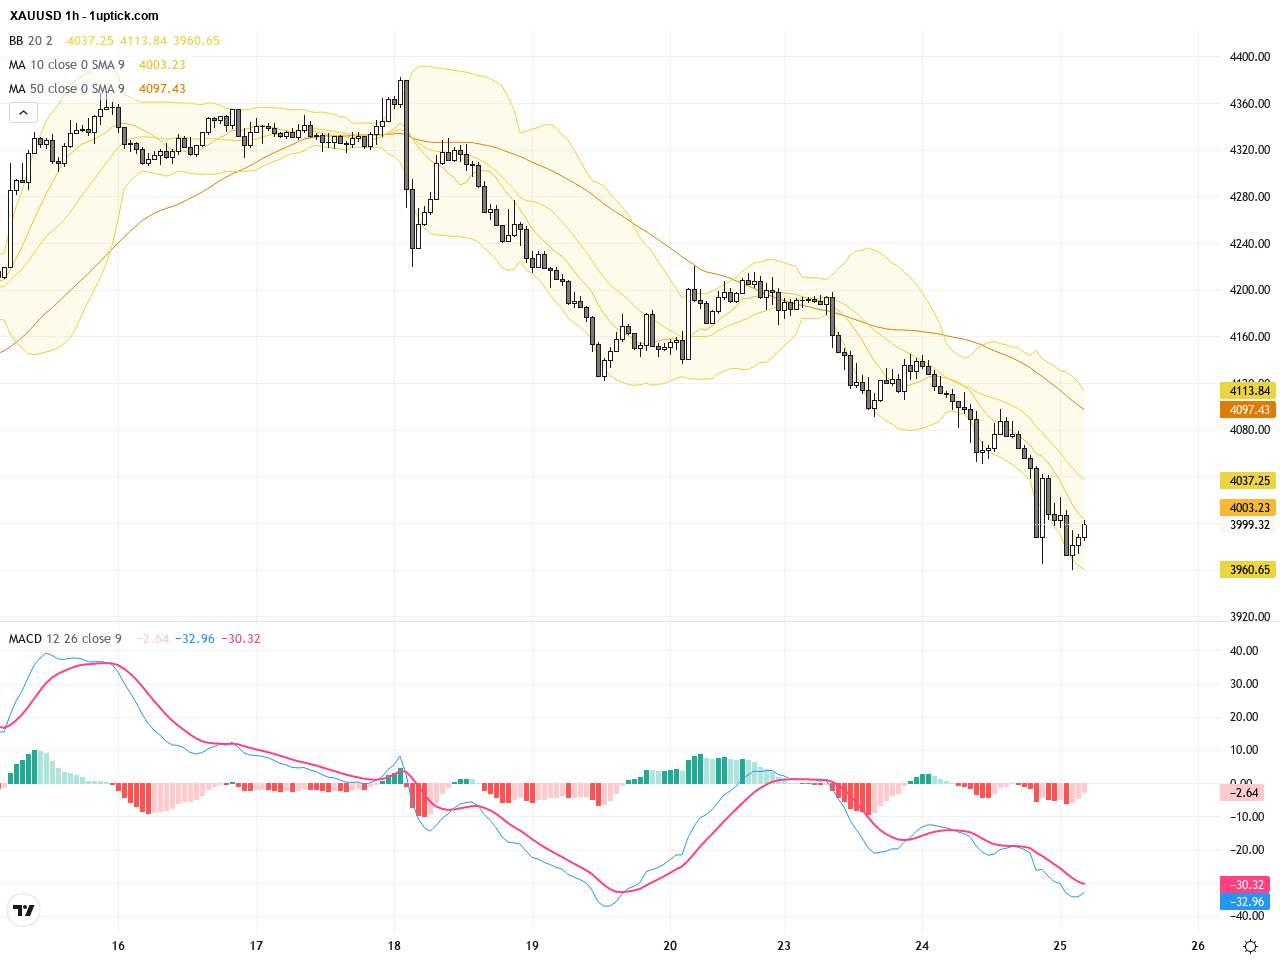
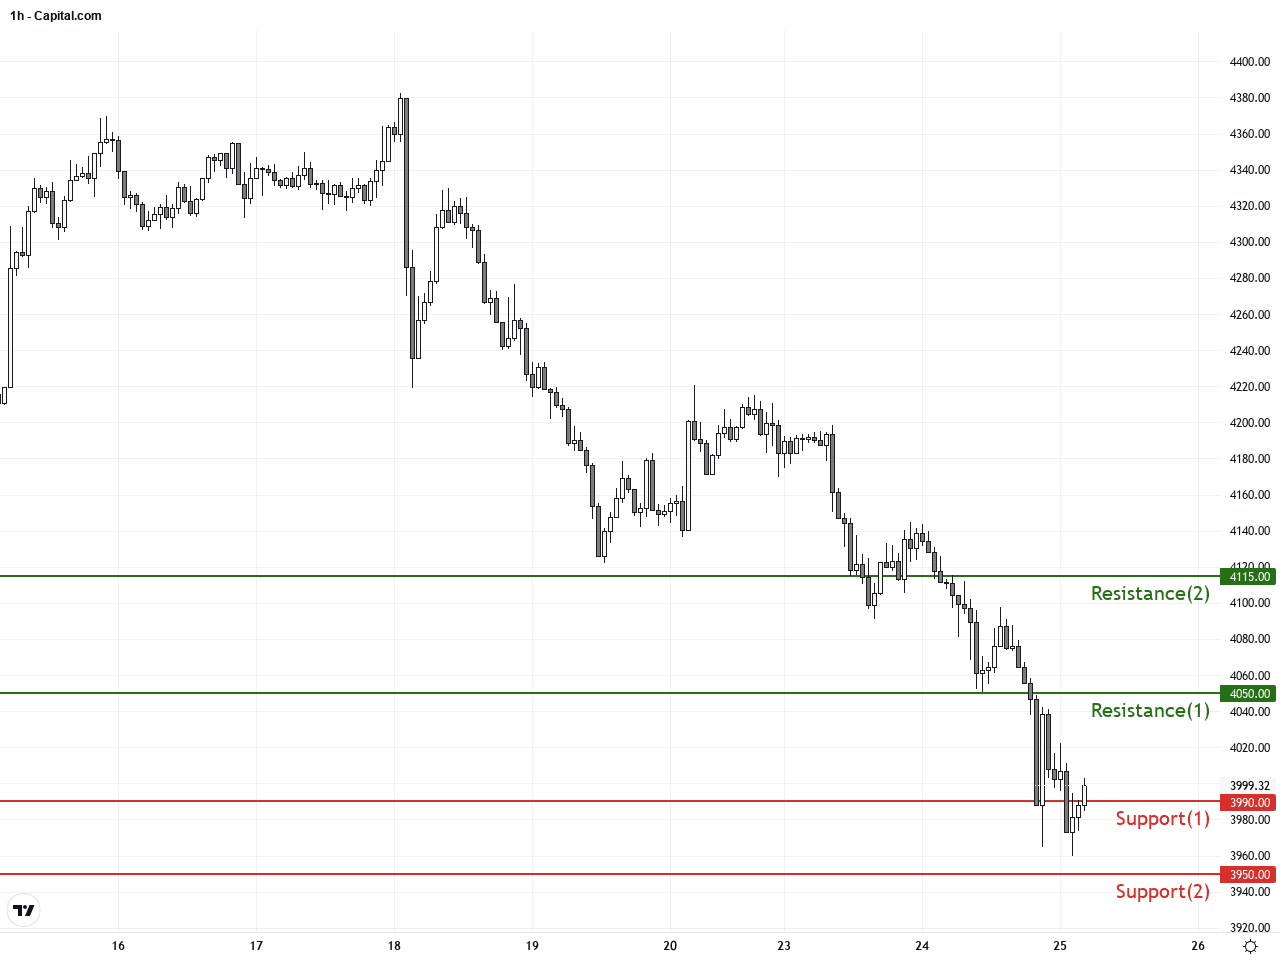
Looking at the last 5 trading days on the hourly chart, gold has been consolidating in a downward sloping triangle pattern, with the neckline near current prices. Short-term moving averages remain below longer-term ones, and the Bollinger Bands have tightened, indicating reduced volatility. A recent bearish engulfing candlestick pattern signals prevailing selling pressure in the next 24 hours, limiting bullish potential unless key resistance is broken with volume support.
Technical Trend: The current XAUUSD trend is decisively bearish and weakening, indicating volatile downside movement.
Technical indicators point to continued bearish pressure with limited volume support. Both MACD and RSI suggest oversold conditions but lack clear reversal signals. Monitoring the descending triangle breakout and the critical support at 3990 is essential. Any breach above moving averages and the Bollinger middle band could signal a short-term bounce opportunity.Today’s GMT+1 economic calendar shows no directly impactful events for gold. However, Australia’s CPI and US weekly crude oil inventory data could indirectly influence market sentiment. A softer Australian inflation figure may reduce safe-haven demand, pressuring gold prices, while a sharper-than-expected US oil inventory drawdown could improve risk appetite and support gold through hedge demand. Overall, no major data release is expected to trigger significant moves in XAUUSD today.
Resistance & Support
The above financial market data, quotes, charts, statistics, exchange rates, news, research, analysis, buy or sell ratings, financial education, and other information are for reference only. Before making any trades based on this information, you should consult independent professional advice to verify pricing data or obtain more detailed market information. 1uptick.com should not be regarded as soliciting any subscriber or visitor to execute any trade. You are solely responsible for all of your own trading decisions.