 |
| Gold V.1.3.1 signal Telegram Channel (English) |

GBPUSD: Critical Support Holds as Technical Patterns Signal Consolidation, June 26, 2026
2026-06-26 @ 13:01
Over the past 24 to 48 hours, the GBP/USD pair has displayed volatility but a slight recovery in the forex market. Yesterday’s closing price was 1.32007, with recent trading ranging between 1.31802 and 1.32015, reflecting cautious market sentiment regarding the pound’s near-term direction.
The price action was chiefly influenced by several key developments. According to FxWirePro, while the US inflation data largely met expectations leading to a modest easing in the dollar, bearish pressure on GBP/USD remains intact. Meanwhile, political uncertainties in the UK continue to weigh on the pound, as market participants digest the impact of leadership changes on future economic policies and outlook. Additionally, fallen oil prices have eased fears of a fresh inflation surge in Britain, providing some support for the pound, yet overall sentiment remains cautious.
For the average investor, the pound’s fluctuation amid political uncertainty is akin to holding a valuable bond in an unpredictable environment—price has recovered slightly, but the looming uncertainty calls for close monitoring of upcoming political developments and global economic trends to guard against stronger currency swings.
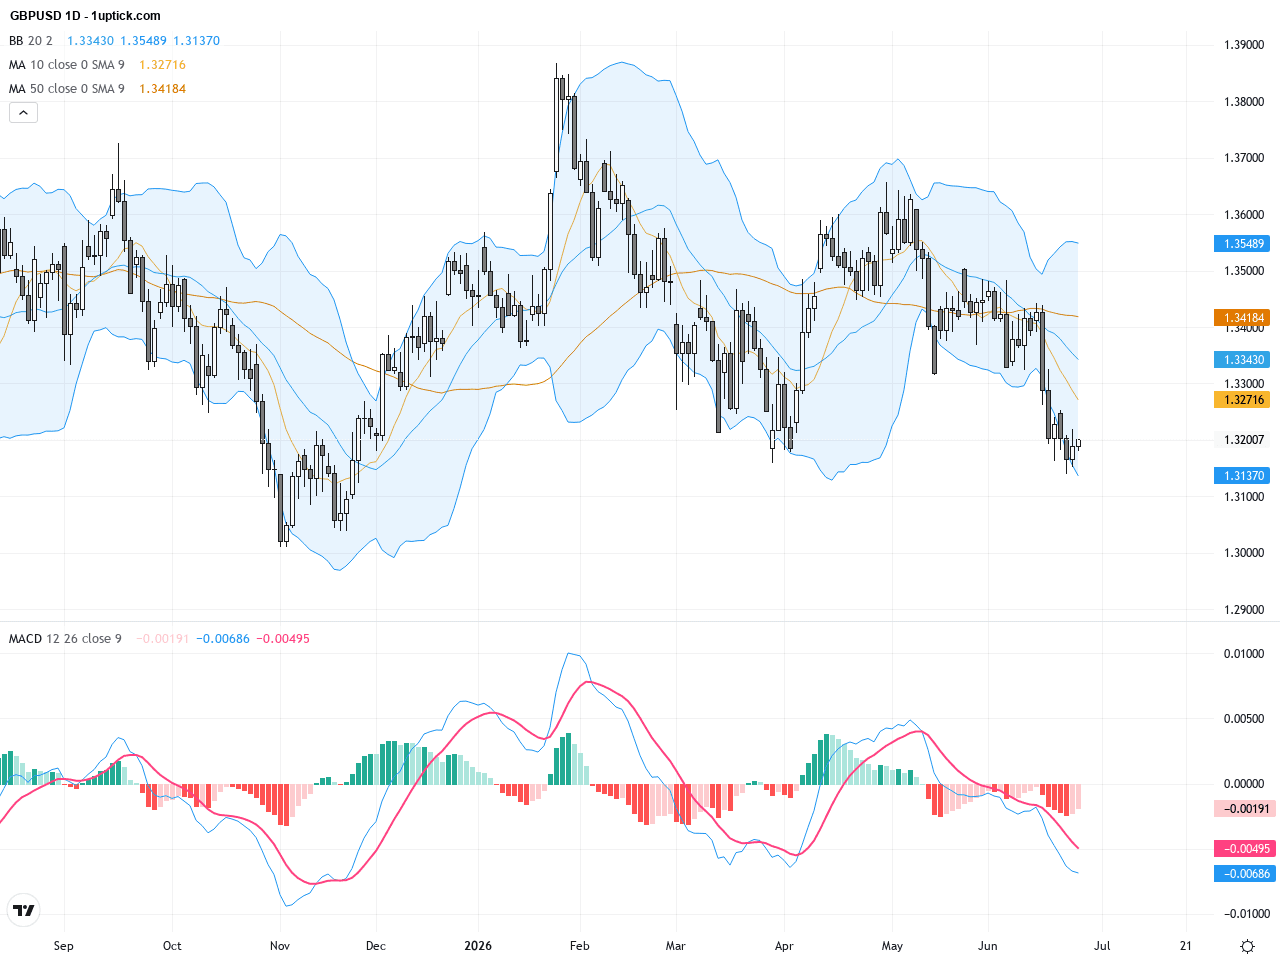
The daily chart shows GBPUSD gradually declining from a recent high around 1.365. The price is now confined between 1.31 and 1.32. The 50-day (1.35) and 200-day (1.34) moving averages remain above price, confirming a medium to long-term bearish bias. Bollinger Bands are narrowing, indicating low volatility, while MACD is flattening, suggesting a market lacking strong directional conviction. Although there have been minor rebounds, resistance around 1.32 has held firm, pointing to a likely continuation of range-bound trading in the short term.
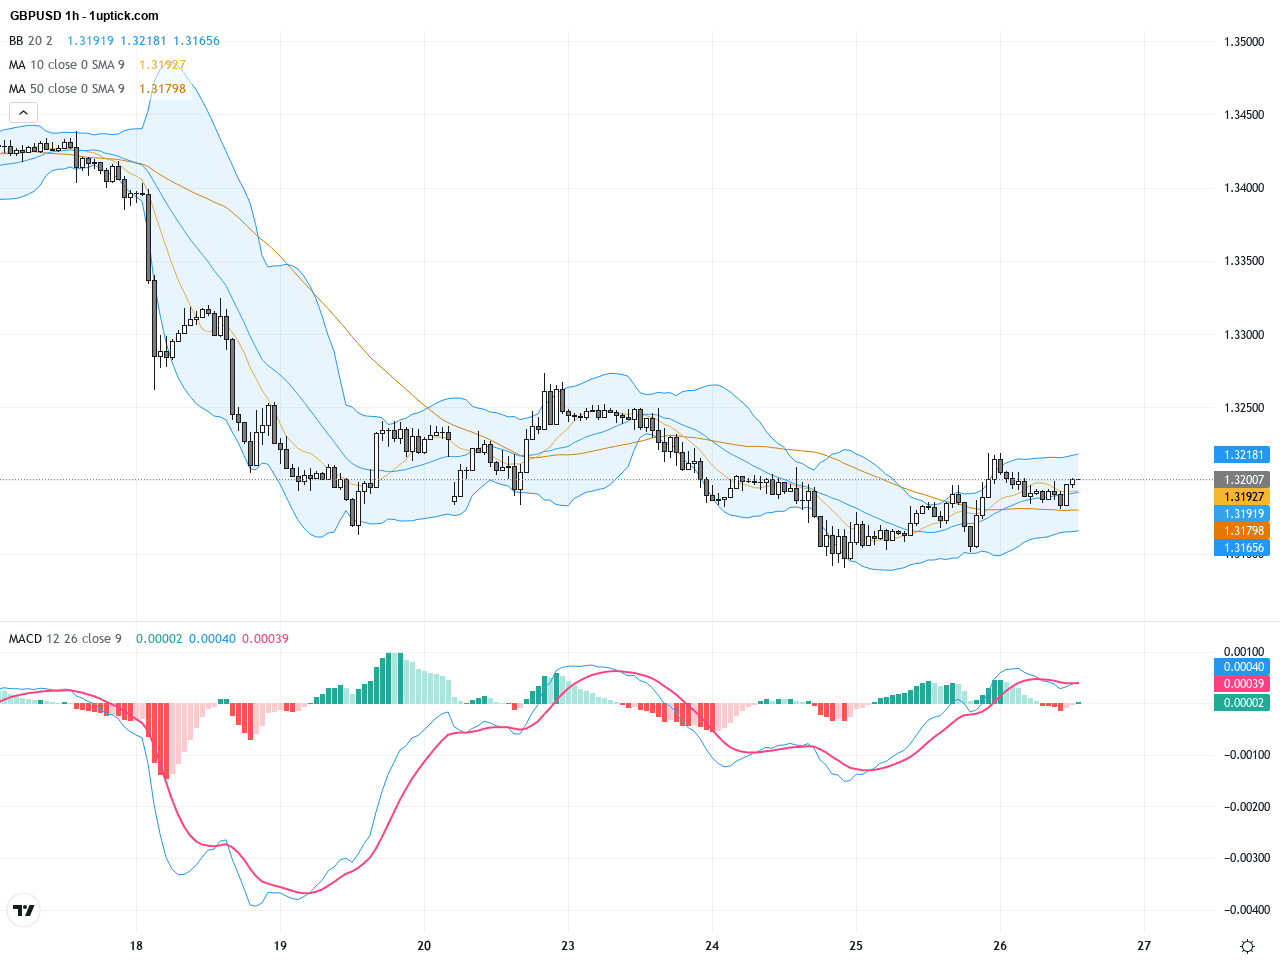
On the hourly chart, GBPUSD has been testing support near 1.3150 and resistance around 1.3200 over the past 3 to 5 days. Short-term moving averages are intertwined, reflecting indecision, with Bollinger Bands still contracting. MACD oscillates near the zero line, indicating weak momentum. A recent doji candlestick signals a battle between buyers and sellers. Traders should await a breakout from this consolidation for clearer directional clues.
Technical Trend: Consolidation
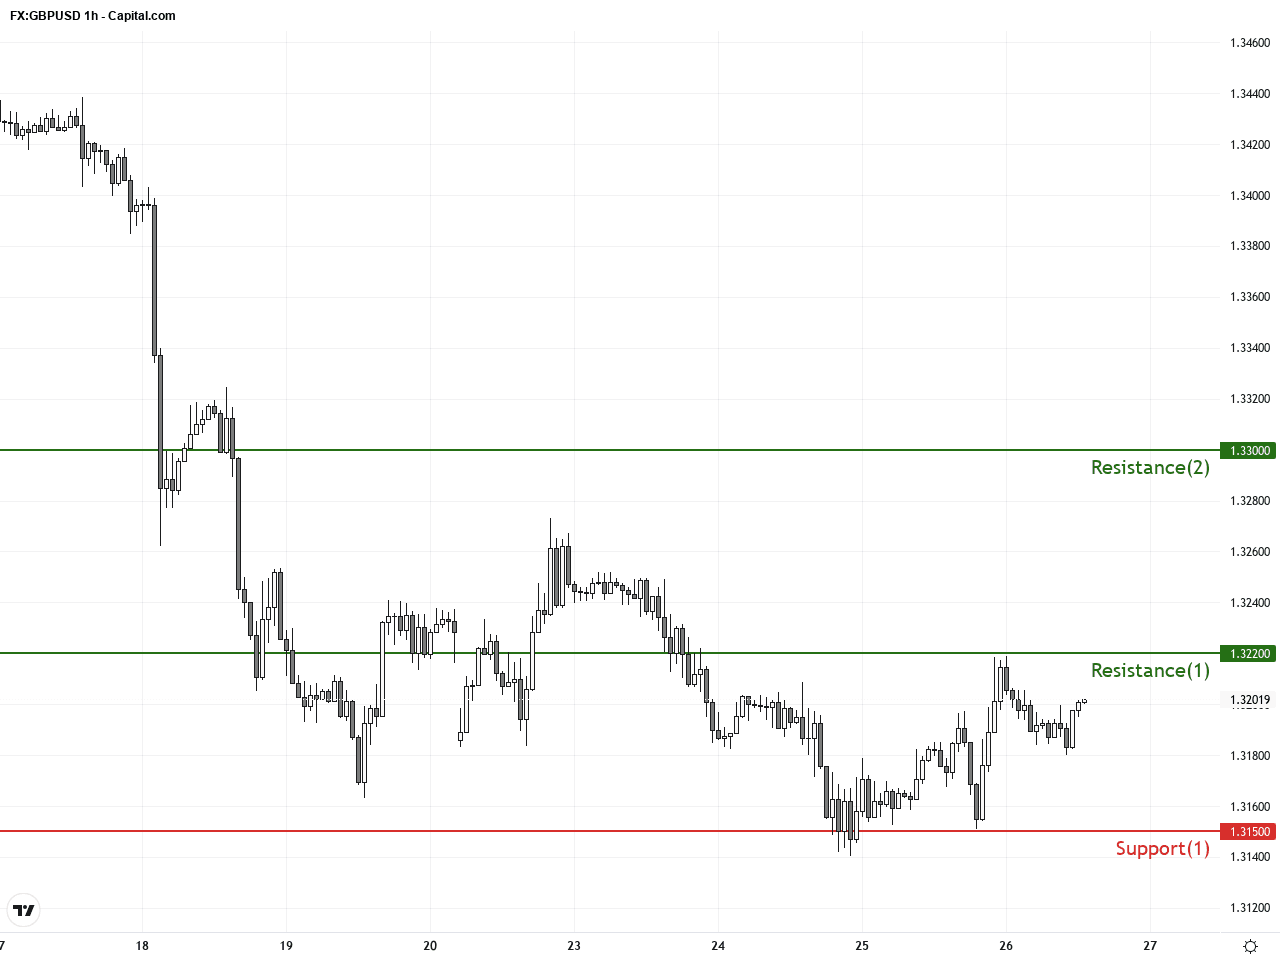
Technically, GBPUSD is in a consolidation phase with balanced buying and selling pressures. The daily MACD is flat, and Bollinger Bands are narrowing, indicating subdued volatility. The hourly doji candlestick underlines near-term indecision, suggesting traders should remain cautious until a breakout emerges. A decisive move above 1.3220 may open the path toward 1.33, while a breakdown below 1.3150 could lead to further drops toward 1.31 or 1.3050. Momentum and volume shifts will be pivotal for trading entries.Today’s economic calendar (GMT+1) reveals no major UK or US data releases directly impacting GBPUSD. Several Federal Reserve officials are scheduled to speak, which could add some volatility but no concrete data will be released. Tokyo’s core CPI matched expectations at 1.6%, with limited impact on the USD. Overall, the day lacks significant events to drive GBPUSD and the market is likely to focus on ongoing political developments and prior inflation data.
Resistance & Support
The above financial market data, quotes, charts, statistics, exchange rates, news, research, analysis, buy or sell ratings, financial education, and other information are for reference only. Before making any trades based on this information, you should consult independent professional advice to verify pricing data or obtain more detailed market information. 1uptick.com should not be regarded as soliciting any subscriber or visitor to execute any trade. You are solely responsible for all of your own trading decisions.