 |
| Gold V.1.3.1 signal Telegram Channel (English) |
USDJPY Technical and Fundamental Analysis: Approaching Two-Year High Amid Intervention Risks, June 26, 2026
2026-06-26 @ 11:01
Over the past 24 to 48 hours, the USD/JPY currency pair has shown slight retracement following a sustained rally, closing yesterday at 161.77, with intraday price swings between 161.689 and 161.85. Market attention has been focused on Japan’s newly announced $2.3 trillion investment plan, which has raised concerns about rising Japanese government bond yields and its potential impact on the yen.
Meanwhile, the US 10-year Treasury yield has continued to drift lower this week, encouraging greater risk appetite among investors and supporting the US dollar’s strength. However, expectations of tighter Federal Reserve monetary policy have intensified, especially following Fed Chair Yellen’s remarks, making the dollar index (DXY) and USD/JPY primary trading vehicles on speculation of further US rate hikes.
These developments suggest the USD/JPY rally may be nearing exhaustion, with growing fears of Bank of Japan intervention adding volatility to the pair. For the average investor, this period exemplifies the complex interplay of geopolitical tensions and divergent monetary policies shaping currency markets—highlighting the need for vigilance when trading around such fundamental shifts.
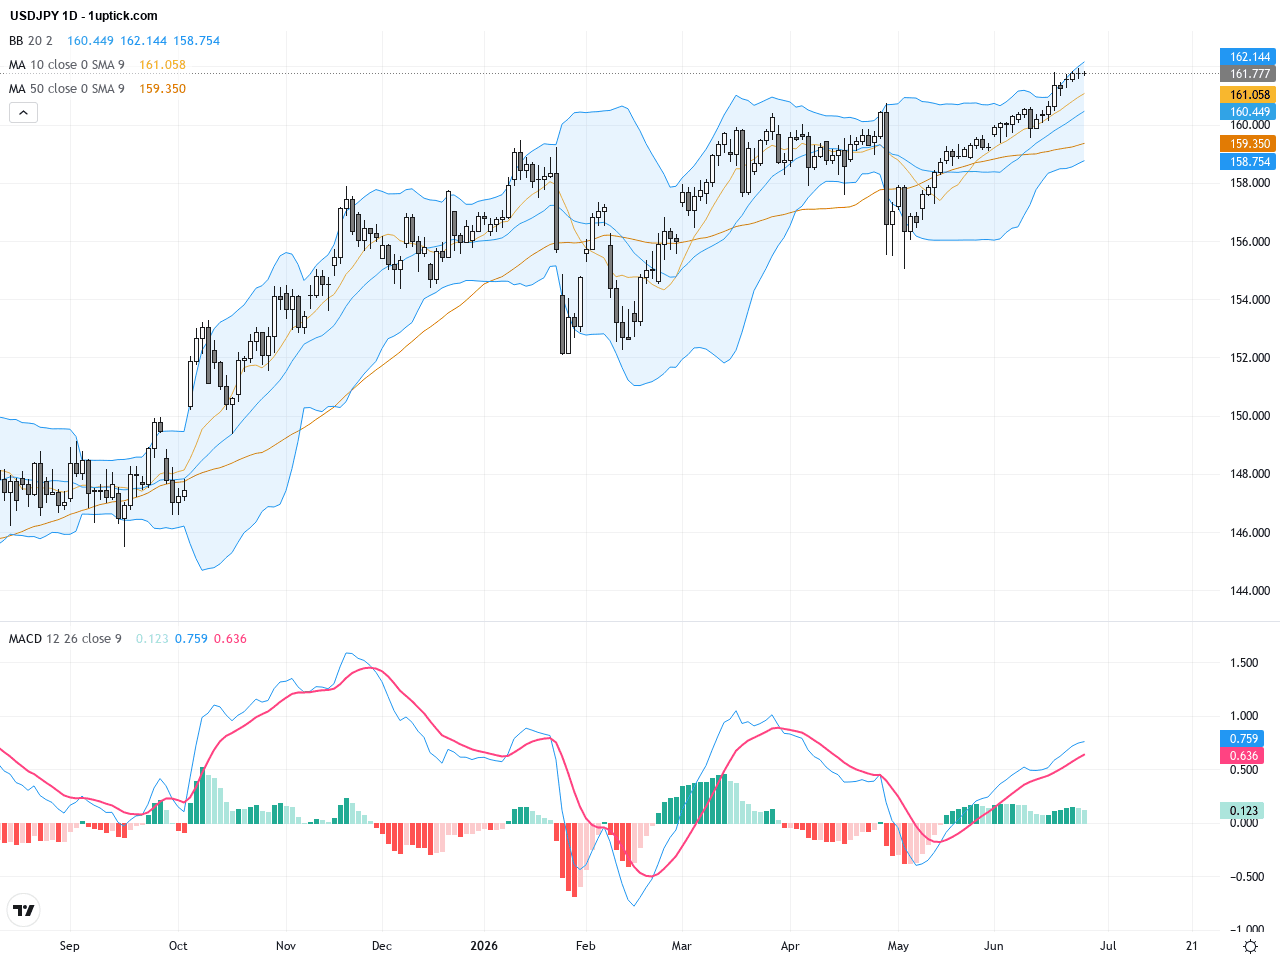
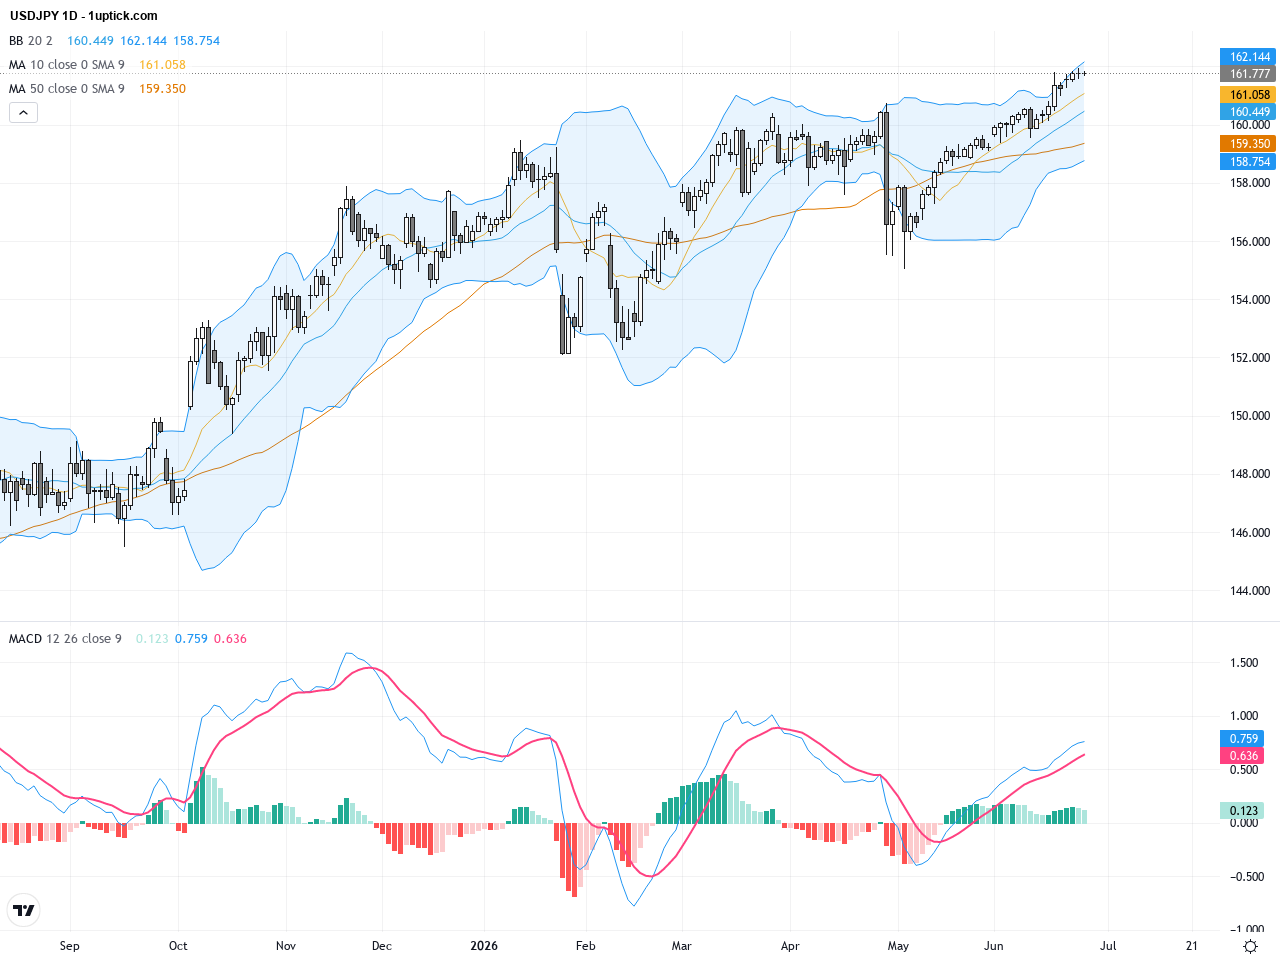
The daily chart illustrates a sustained uptrend in USDJPY, beginning near the 159 level and advancing decisively above both the 50-day and 200-day moving averages, indicating strong medium-to-long-term bullish momentum. Bollinger Bands are expanding, signaling increased volatility. The MACD remains elevated, confirming sustained buying interest. Overall, the trend remains bullish, though signs of weakening momentum near highs suggest caution for potential consolidation or pullbacks.
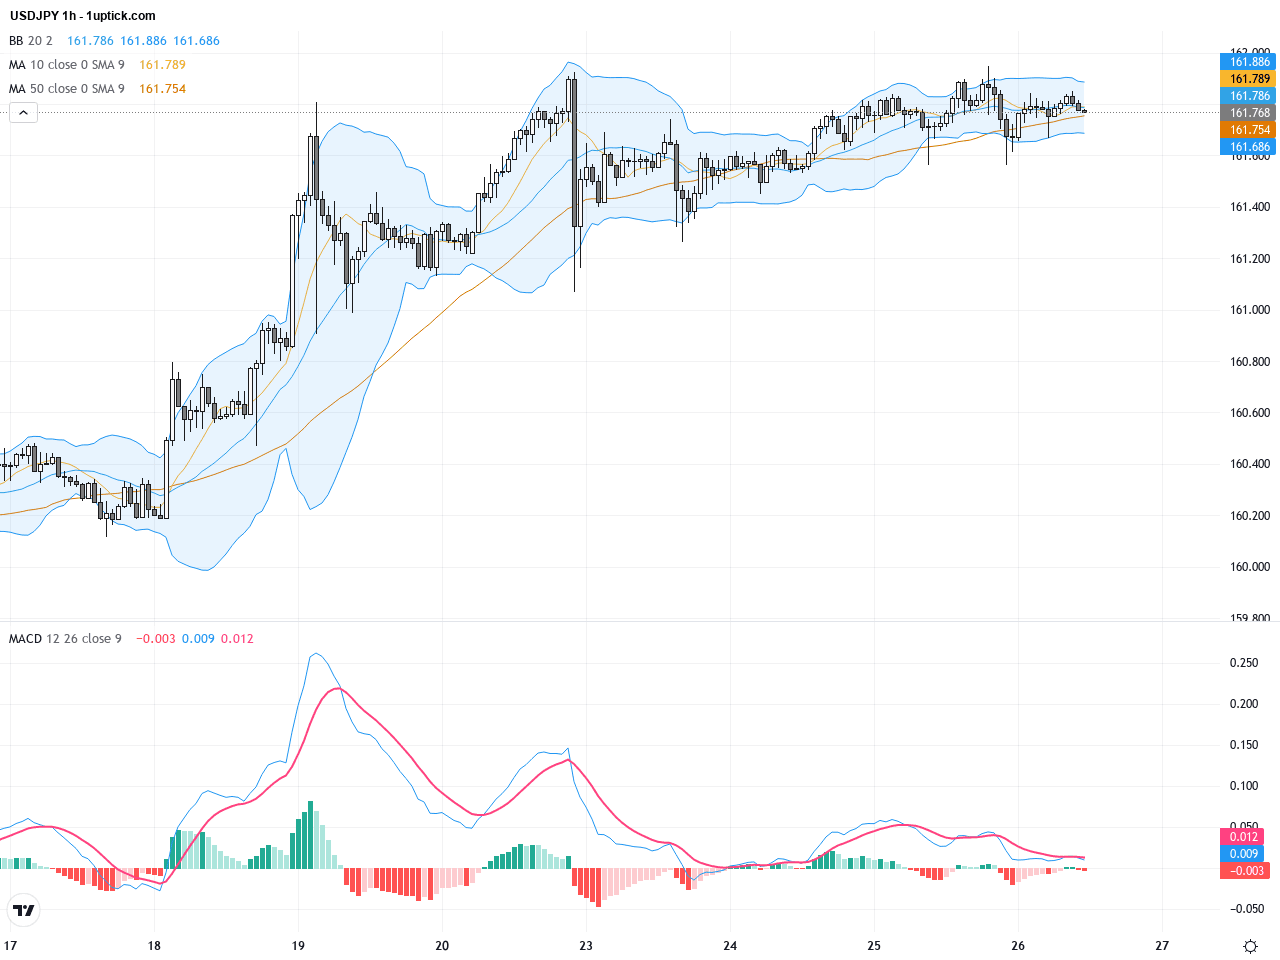
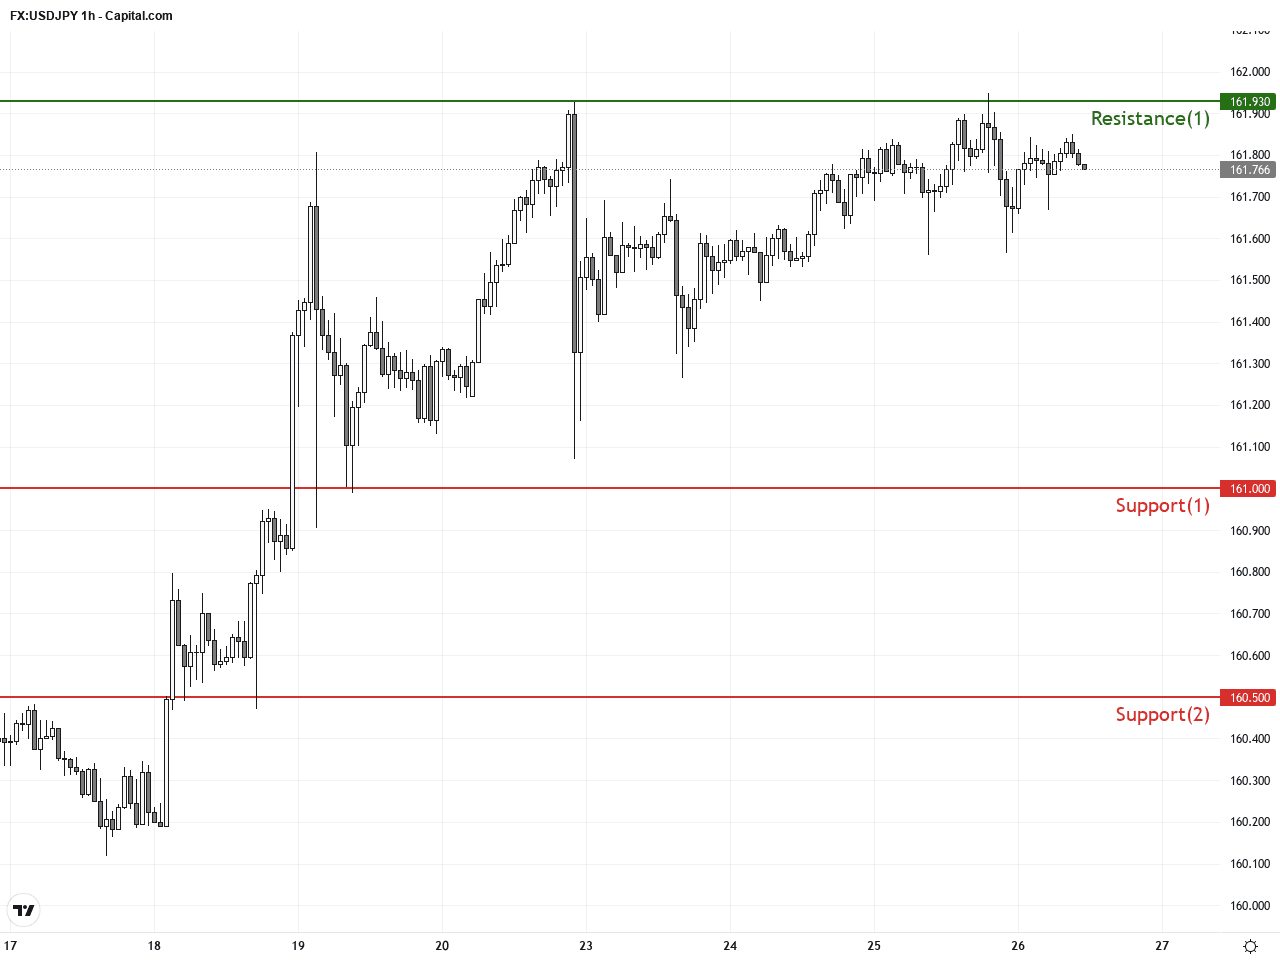
The hourly chart over the last 3-5 days shows USDJPY experiencing sharp rallies followed by brief consolidations, forming a flag-like pattern. Short-term moving averages are aligned bullishly, but price faces resistance near 161.90, encountering slight retracements. MACD divergence has appeared recently, hinting at fading short-term momentum. A hammer candlestick formed recently signals strong support from below, suggesting potential for continued upward moves with near-term sideways action.
Technical Trend: Current trend: Steady bullish with potential short-term sideways consolidation
Technically, USDJPY maintains a strong bullish trend, particularly after breaking above both the 50 and 200-day moving averages which bolster buyer confidence. However, short-term MACD divergence and the recent hammer candlestick caution of possible near-term consolidation. Traders should monitor volume shifts for momentum clues and be wary of risks near historic highs, especially considering potential BOJ intervention.Today’s economic calendar (GMT+1) features key US data at 14:30, including Personal Consumption Expenditures (PCE) and core inflation figures, which are highly relevant for USDJPY. Stronger-than-expected PCE numbers could boost the USD, thereby supporting USDJPY. Conversely, weaker data might pressure USDJPY lower. Other releases from Australia, Germany, and European countries carry minimal direct impact on this pair.
Resistance & Support
The above financial market data, quotes, charts, statistics, exchange rates, news, research, analysis, buy or sell ratings, financial education, and other information are for reference only. Before making any trades based on this information, you should consult independent professional advice to verify pricing data or obtain more detailed market information. 1uptick.com should not be regarded as soliciting any subscriber or visitor to execute any trade. You are solely responsible for all of your own trading decisions.