 |
| Gold V.1.3.1 signal Telegram Channel (English) |

USDJPY: Approaching 162 Key Resistance Amid Intervention Risks in Strong Uptrend, June 29, 2026
2026-06-29 @ 11:01
Over the past 24 to 48 hours, USD/JPY has maintained a strong upward trend, steadily climbing from yesterday’s closing price of around 161.787 and approaching the key psychological level of 162.00. Although Japan’s Ministry of Finance has so far refrained from intervening in the forex market, ongoing speculation about possible intervention has kept investors on high alert. The recent strength of the US Dollar Index has supported USD/JPY’s rise, while the sharp drop in crude oil prices has somewhat alleviated pressure on the dollar’s occasional weakness.
According to multiple recent reports, the USD/JPY is nearing a 40-year high with over 90% of traders holding short positions, indicating significant short-term sentiment divergence in the market. The dollar’s strength is not isolated to individual currency pairs but reflects a broader US Dollar Index breakout, which has helped major pairs including USD/JPY push higher.
For the average investor, this rally means the traditionally safe-haven yen is coming under pressure, raising the relative appeal of dollar assets. However, if Japan decides to intervene, the market will likely experience increased volatility. Investors should watch the Japanese government’s stance and US interest rate movements closely, as these factors will directly influence USD/JPY’s near-term trajectory.
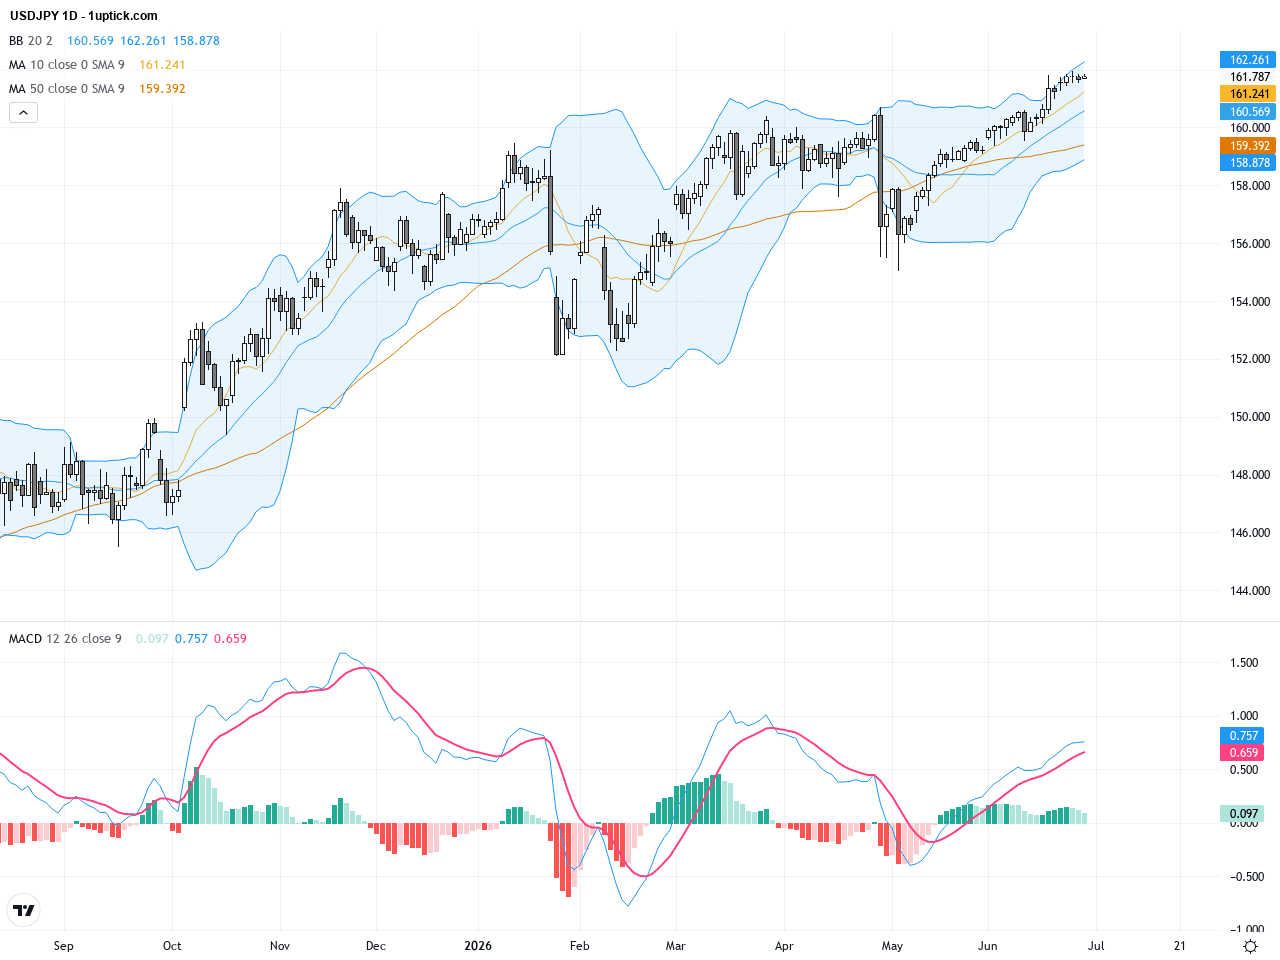
Daily chart analysis shows USDJPY in a clear uptrend from around 156, with price steadily riding above short and medium-term moving averages. Bollinger Bands have widened, reflecting increased volatility, while the price stays above the mid-band, indicating bullish control. The MACD is positioned well above the zero line, signifying strong upward momentum. Recently, price has tested the 161.8 to 162 zone multiple times, forming a strong resistance level which could impede further ascent without decisive breakout.
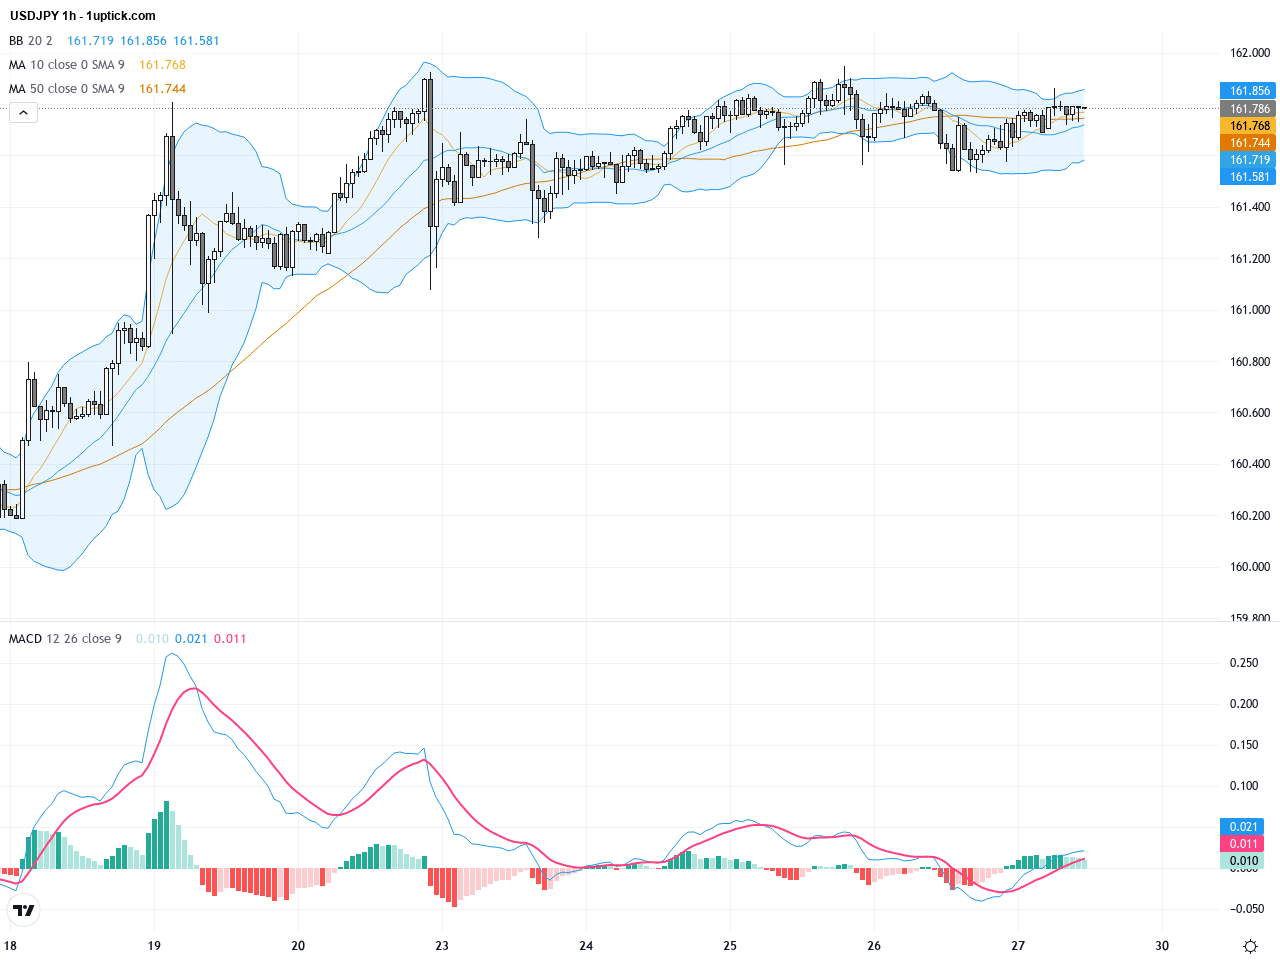
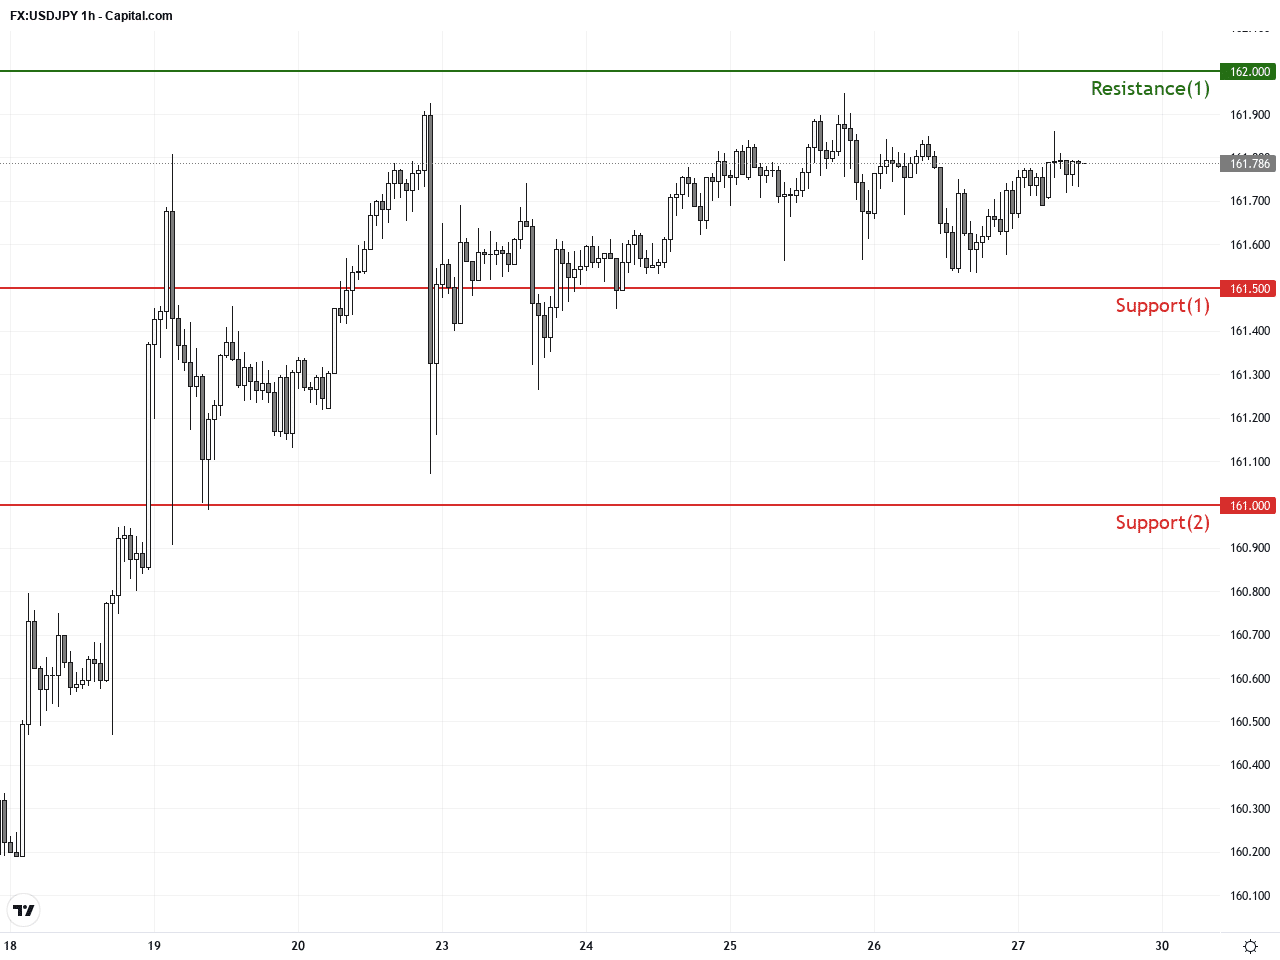
On the hourly chart spanning the last 3-5 days, USDJPY has been consolidating between 161.5 and 162. The moving averages align for a bullish setup, but price is currently pushing against the upper Bollinger Band and has seen a minor MACD bearish crossover, signaling short-term momentum slowdown. This suggests a delicate phase where a breakout above 162 could trigger further gains, whereas failure to breach may result in a pullback below 161.5.
Technical Trend: The current trend shows a cautiously bullish stance with the pair navigating between strong upward momentum and the risk of policy intervention and technical resistance.
Technically, USDJPY approaches a critical resistance near 162. Momentum indicators like MACD and RSI reflect some bearish divergence, indicating a potential short-term correction or consolidation before any sustained breakout. Traders should watch for either a strong break above 162.00, which could confirm bullish continuation, or signs of rejection that would warrant caution and protective stops.Today’s GMT+1 economic calendar features speeches from RBA Governor Bullock and FOMC Member Barkin. These events carry limited direct impact on USDJPY in the near term, given the indirect relation with AUD and the broad nature of Fed commentary without scheduled data releases. No significant economic releases affecting USDJPY are expected today.
Resistance & Support
The above financial market data, quotes, charts, statistics, exchange rates, news, research, analysis, buy or sell ratings, financial education, and other information are for reference only. Before making any trades based on this information, you should consult independent professional advice to verify pricing data or obtain more detailed market information. 1uptick.com should not be regarded as soliciting any subscriber or visitor to execute any trade. You are solely responsible for all of your own trading decisions.