 |
| Gold V.1.3.1 signal Telegram Channel (English) |

EURUSD: Triangular Consolidation Sets Stage for Critical Breakout, Trading Outlook Focuses on 1.16 Level, June 1, 2026
2026-06-01 @ 09:01
Over the past 24 to 48 hours, the EUR/USD exchange rate hovered between 1.1640 and 1.1660, closing at 1.16478, slightly down from the previous close of 1.16621. The U.S. Dollar Index (DXY) remained firm around 99.08, signaling continued strength in the dollar.
According to the latest market news, the easing tensions between the U.S. and Iran have reduced some demand for the dollar as a safe haven, yet geopolitical factors continue to provide support to the greenback. This caused the EUR/USD to show some resilience in recent days as the euro attempts to stabilize. However, the robust dollar pressure capped any significant euro rebound, resulting in a mild overall decline.
In layman’s terms, for the average investor, the currency market dynamics resemble a tug of war between two balanced forces: the dollar’s strength backed by geopolitical and economic fundamentals versus the euro’s attempts to recover on positive peace developments. This suggests that the exchange rate is likely to remain range-bound in the near term. Investors should stay calm and closely monitor geopolitical and economic data releases to better navigate trading opportunities.
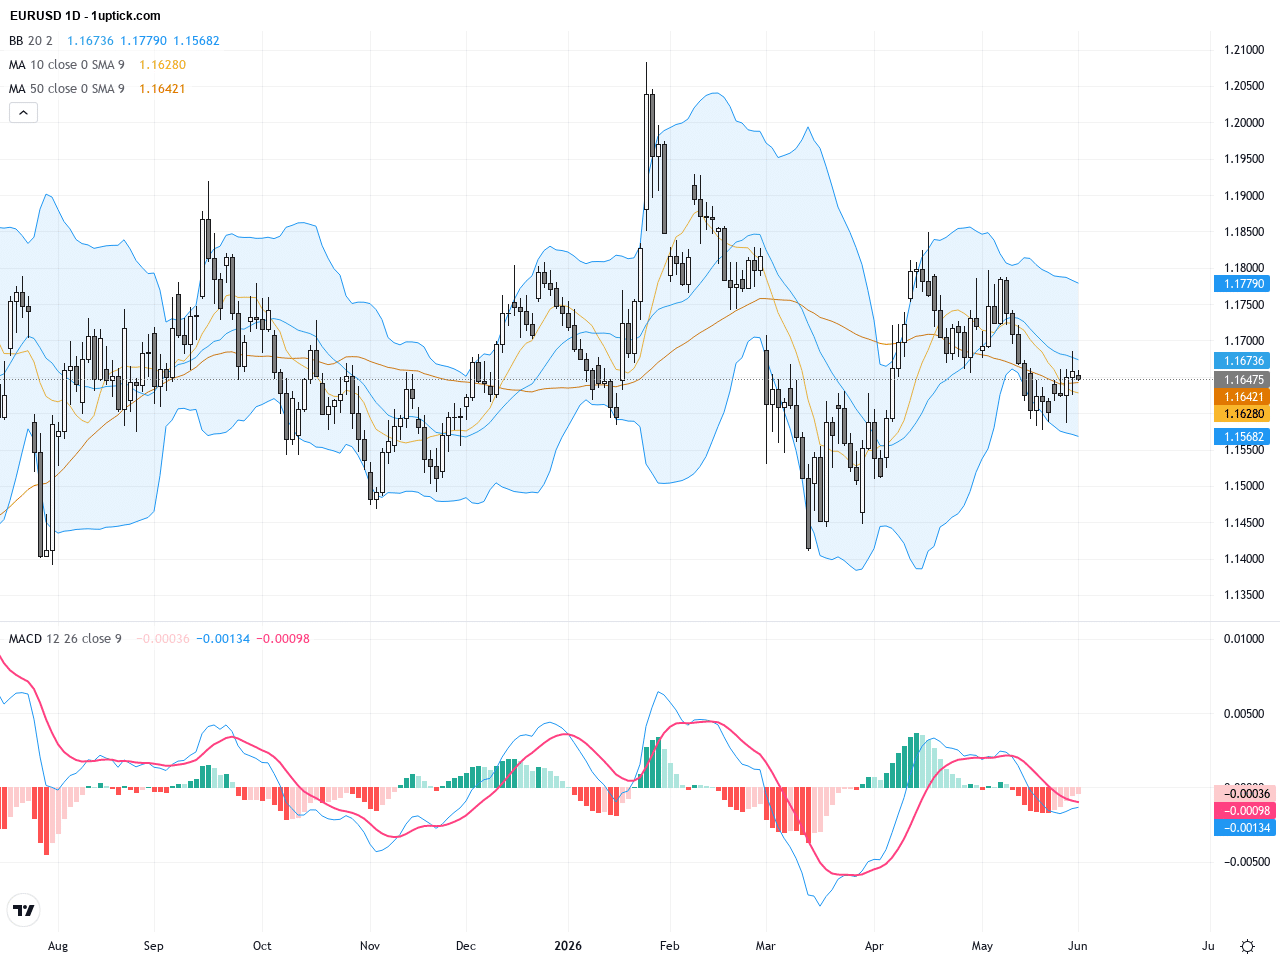
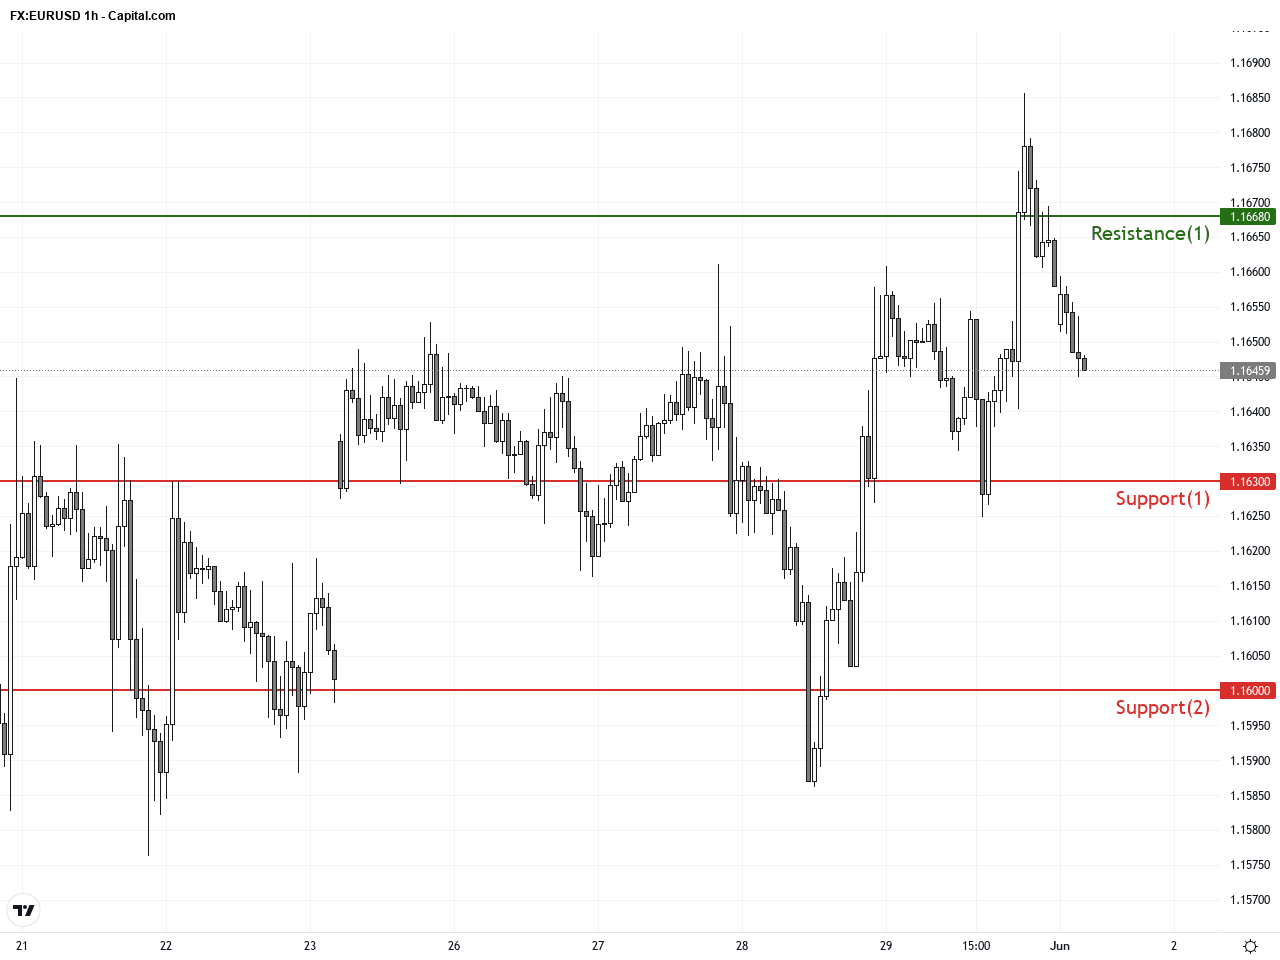
The daily chart reveals that since rebounding from lows near 1.15, EURUSD has made higher lows and highs but has consolidated over the past three days in a narrowing triangle between 1.164 and 1.166. The 50- and 200-day moving averages around 1.17 present clear resistance. Bollinger Bands are contracting, signaling reduced volatility, while the MACD hovers near the zero line, showing no decisive momentum. The daily trend is currently sideways, awaiting a breakout from this consolidation phase.
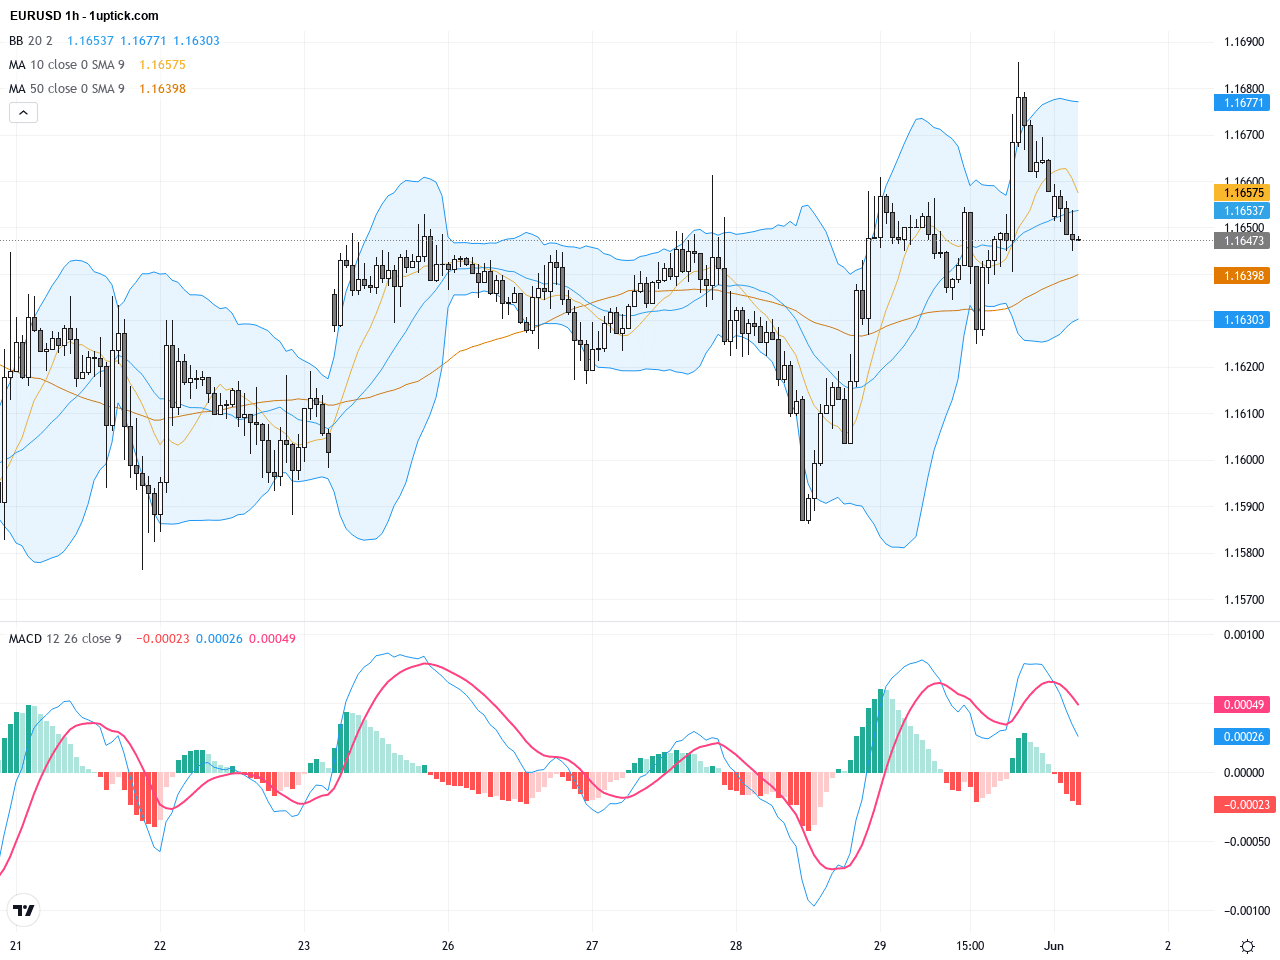
The hourly chart over the last 3-5 trading days shows EURUSD in range-bound action, with short-term moving averages crossing and flattening, indicating a tug-of-war between bulls and bears. The MACD lines frequently cross, reinforcing the lack of clear direction. Narrowing Bollinger Bands reflect shrinking volatility and a likely imminent breakout. Recent candles with long upper wicks and doji formations suggest some selling pressure testing support levels.
Technical Trend: EURUSD currently shows a volatile sideways trend, consolidating within a critical technical range awaiting breakout direction.
Technically, EURUSD is consolidating within a volatility-contracting triangle pattern, awaiting a key breakout. A potential MACD bullish crossover alongside concentrated Fibonacci support zones suggests a short-term directional signal may emerge soon. Recent doji candles and upper shadows display short-term selling pressure but no confirmed reversal. An increase in volume accompanying a breakout will validate a high-probability trade setup.Today’s economic calendar features China’s May NBS Manufacturing and Services PMIs at 03:30 GMT+1, important for global markets but having limited direct impact on EURUSD, which is primarily influenced by Eurozone and US economic data. No other significant events directly related to EURUSD are scheduled today. Price action is expected to be driven more by technical factors and sentiment than fresh economic releases.
Resistance & Support
The above financial market data, quotes, charts, statistics, exchange rates, news, research, analysis, buy or sell ratings, financial education, and other information are for reference only. Before making any trades based on this information, you should consult independent professional advice to verify pricing data or obtain more detailed market information. 1uptick.com should not be regarded as soliciting any subscriber or visitor to execute any trade. You are solely responsible for all of your own trading decisions.