 |
| Gold V.1.3.1 signal Telegram Channel (English) |
GBPUSD: Key Technical Reversal Signals Amid Continued Volatility, June 1, 2026
2026-06-01 @ 13:01
Over the past 24 to 48 hours, the GBP/USD pair experienced notable volatility, reflecting a highly dynamic market sentiment. The closing price yesterday was 1.34569, marking a slight increase of 0.07% from the previous day. During this period, the pair fluctuated between 1.34453 and 1.34592, indicating cautious investor sentiment awaiting clearer direction.
Recent market news highlighted the strengthening of the US Dollar as the US-Iran truce extended, with the US Dollar Index (DXY) holding steady around 99.08. This peace signal initially boosted risk assets, driving GBP/USD to recover somewhat. However, renewed US-Iran tensions alongside weaker-than-expected UK retail sales dropping 1.3% in April have pressured the Pound, intensifying uncertainty and volatility in the currency.
For the average investor, the recent movements in GBP/USD resemble an emotional tug-of-war: optimism fueled by potential peace deals on one side, countered by geopolitical tensions and disappointing economic data on the other. Investors should closely monitor developments in US-Iran relations and UK economic indicators as these factors will likely continue to steer GBP/USD price dynamics in the near term.

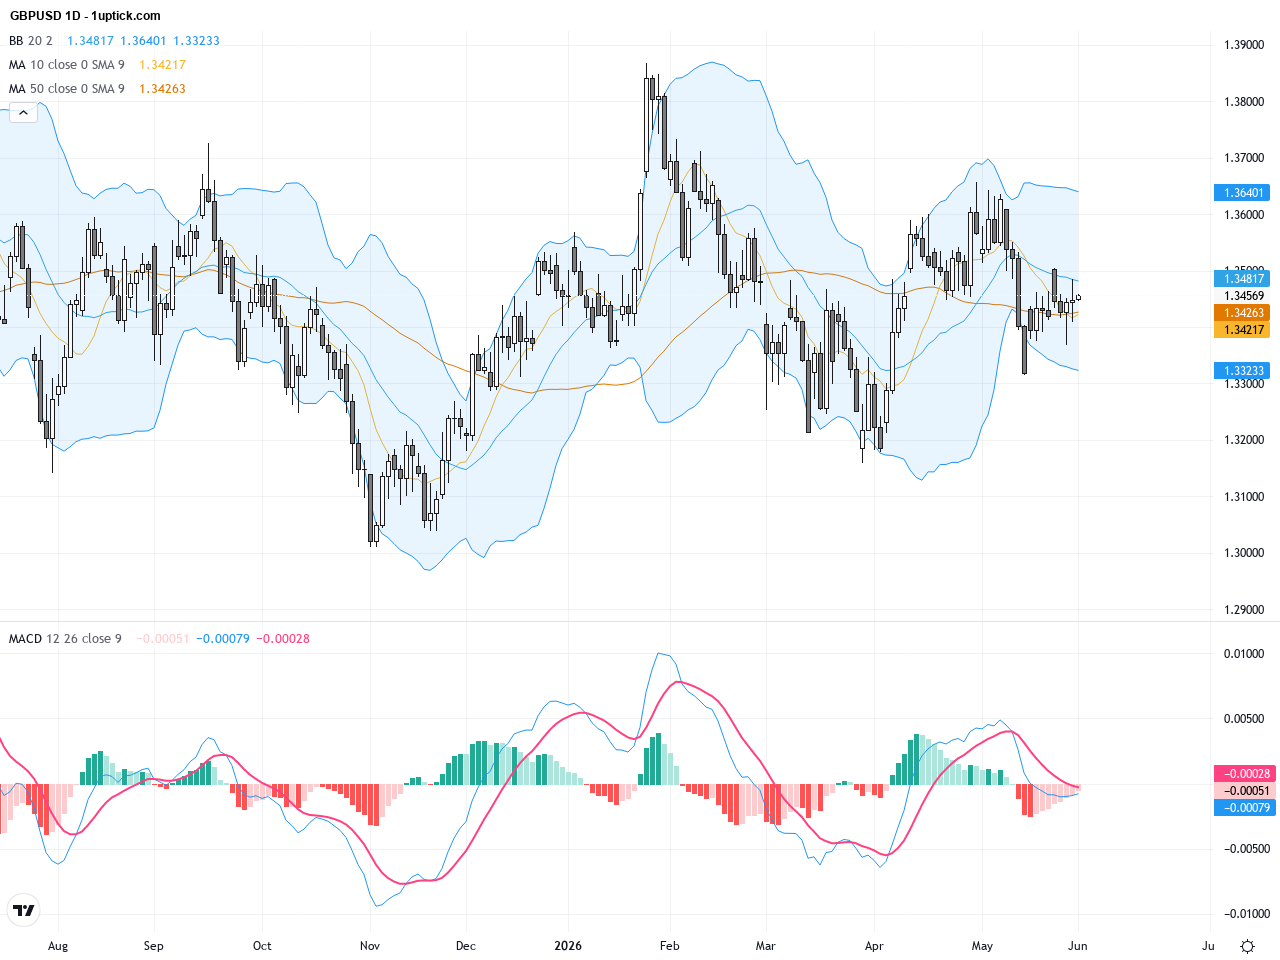
The daily chart shows GBPUSD retreating slightly from near 1.3500 to a consolidation range between 1.3400 and 1.3450. The 50-day moving average near 1.3470 and the 200-day average around 1.3404 are converging, indicating a lack of clear directional momentum. Bollinger Bands are narrowing, suggesting lower volatility and a potential breakout soon. The MACD histogram is contracting with signal lines nearing a crossover, hinting at a possible trend change ahead.
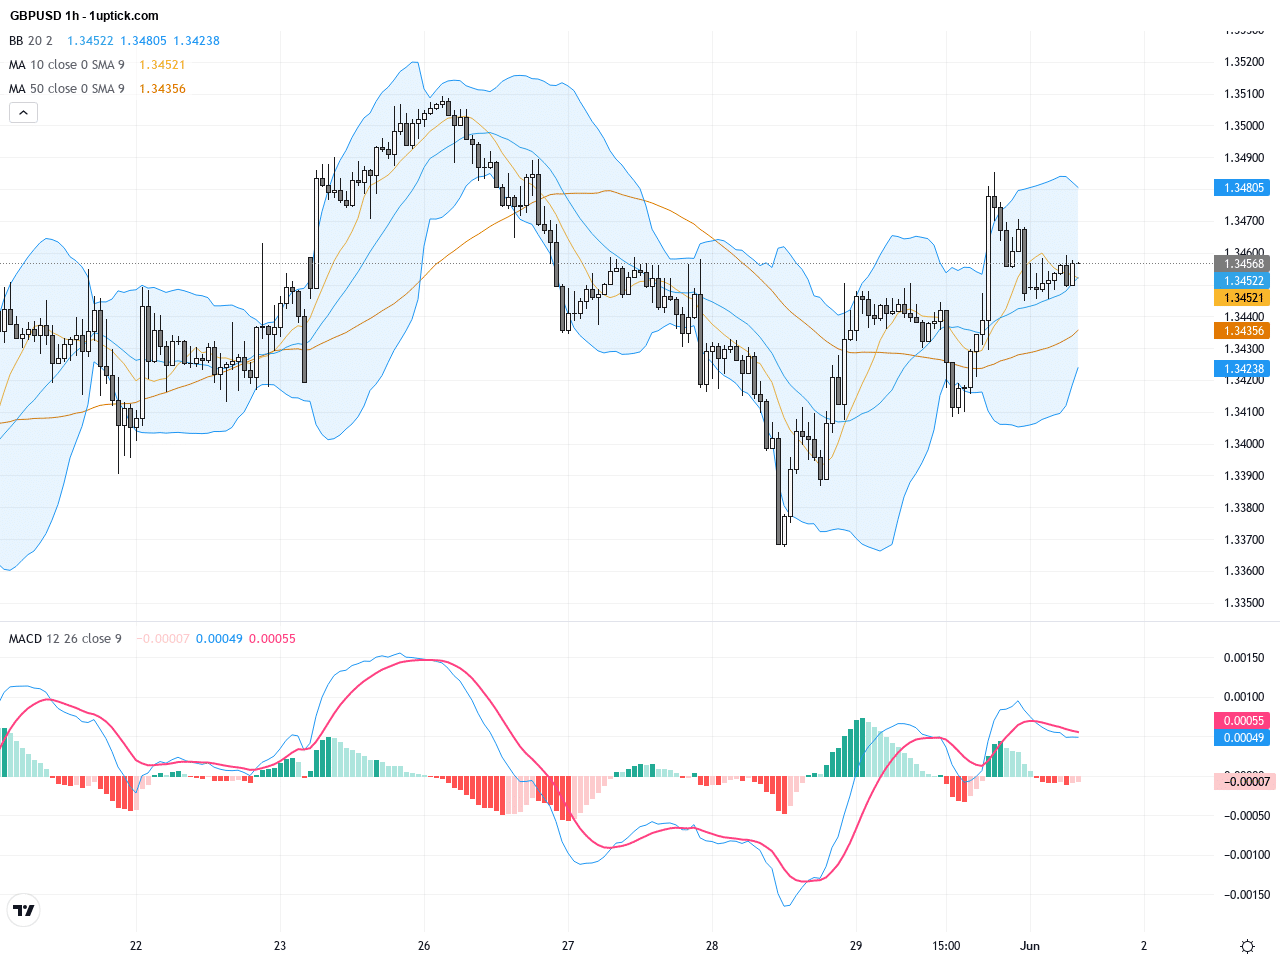
On the hourly chart over the past 3-5 days, GBPUSD has been range-bound with resistance around 1.3470 repeatedly tested and support near 1.3435 holding firm. Short-term moving averages indicate a tug-of-war between bulls and bears, but the recent MACD bullish crossover implies building upward momentum. Bollinger Bands show frequent expansion and contraction, mirroring short-term market indecision. A significant bullish engulfing candlestick recently appeared, signaling a possible rebound within the next 24 hours.
Technical Trend: Current GBPUSD trend is cautiously oscillating with a slight bullish bias
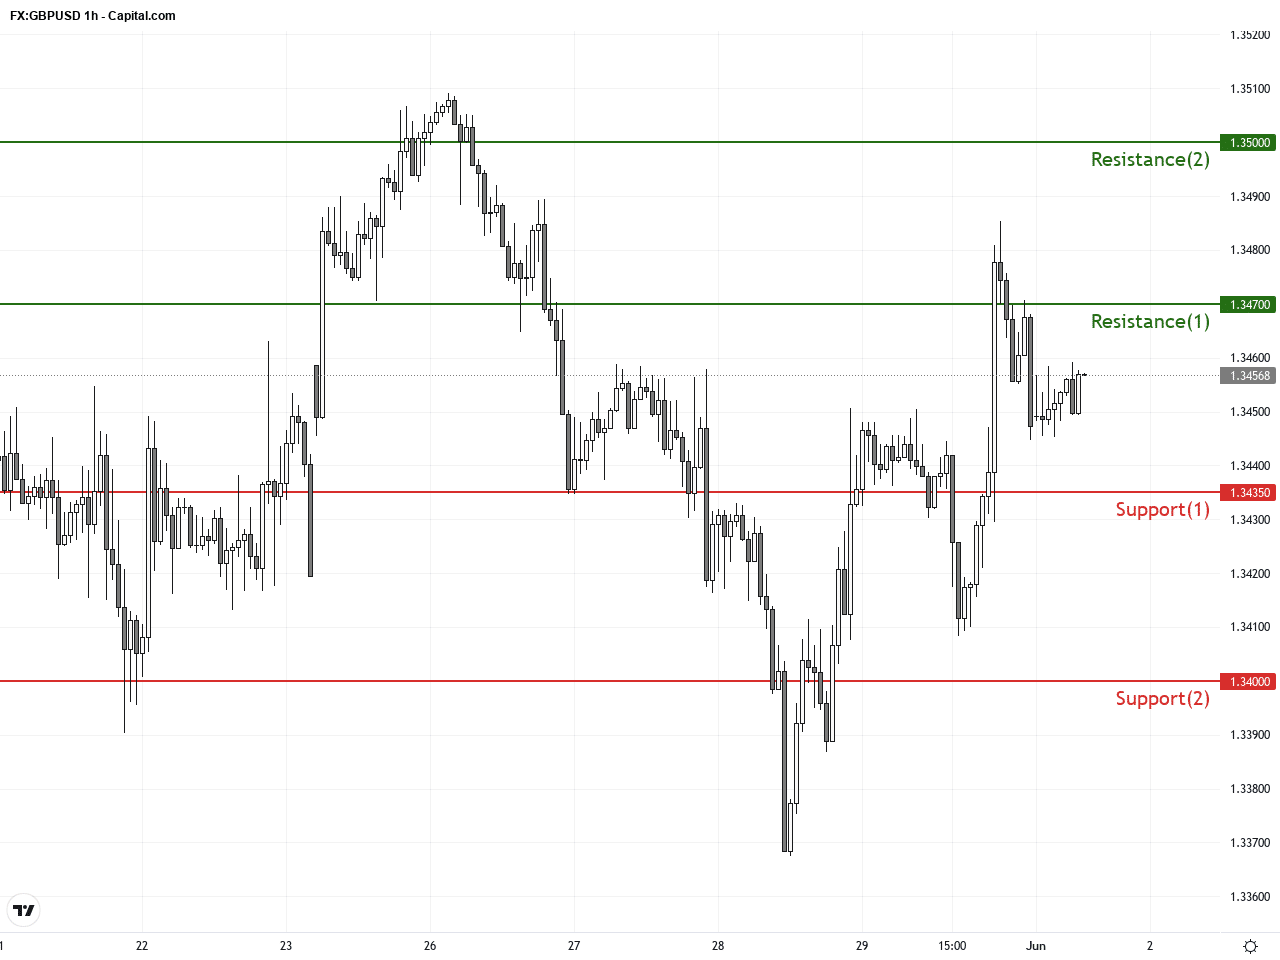
Technical indicators show the daily MACD nearing a bullish crossover, suggesting potential upward momentum buildup. The hourly bullish engulfing pattern increases the likelihood of a short-term price bounce. A break above 1.3470 resistance could lead to tests of 1.3500 and 1.3550, while a drop below 1.3435 support could shift the trend towards weakness and consolidation. Monitoring volume and indicator divergences will be critical to identify high-probability trading setups.Today’s key economic events include the UK Manufacturing PMI for May (forecast 53.7), which could influence GBPUSD if the result meets or exceeds expectations. Later, US manufacturing data and Fed’s Powell speech may impact the USD and thus GBPUSD. While no highly volatile, directly impactful event is scheduled imminently, traders should monitor these releases for any market-moving surprises.
Resistance & Support
The above financial market data, quotes, charts, statistics, exchange rates, news, research, analysis, buy or sell ratings, financial education, and other information are for reference only. Before making any trades based on this information, you should consult independent professional advice to verify pricing data or obtain more detailed market information. 1uptick.com should not be regarded as soliciting any subscriber or visitor to execute any trade. You are solely responsible for all of your own trading decisions.