

 |
| Gold V.1.3.1 signal Telegram Channel (English) |

USDCAD: Bullish Breakout Above 50-SMA Amid Oil Price Volatility and Safe-Haven Demand, June 2, 2026
2026-06-02 @ 13:03
Over the past 24 to 48 hours, the USD/CAD exchange rate has shown notable activity, closing yesterday at 1.38442 with relatively minor shifts but increased volatility. The market has been heavily influenced by several global events, most prominently rising tensions between the US and Iran. This geopolitical strain caused oil prices to surge, sparking safe-haven demand that bolstered the US dollar against the Canadian dollar.
Recent news indicate that despite attempts at ceasefire agreements between the US and Iran, repeated violations have shaken market confidence. Investors have responded to this geopolitical risk by flocking to the US dollar for safety, strengthening USD against CAD. Meanwhile, the Canadian dollar, typically sensitive to oil prices, faced pressure due to weak oil but remained somewhat supported. Throughout May, the Canadian dollar depreciated around 1.6% against the US dollar. For average investors, this market environment means currency prices can be quite volatile amid uncertain geopolitical events, presenting both risks and potential opportunities in a short-term horizon.
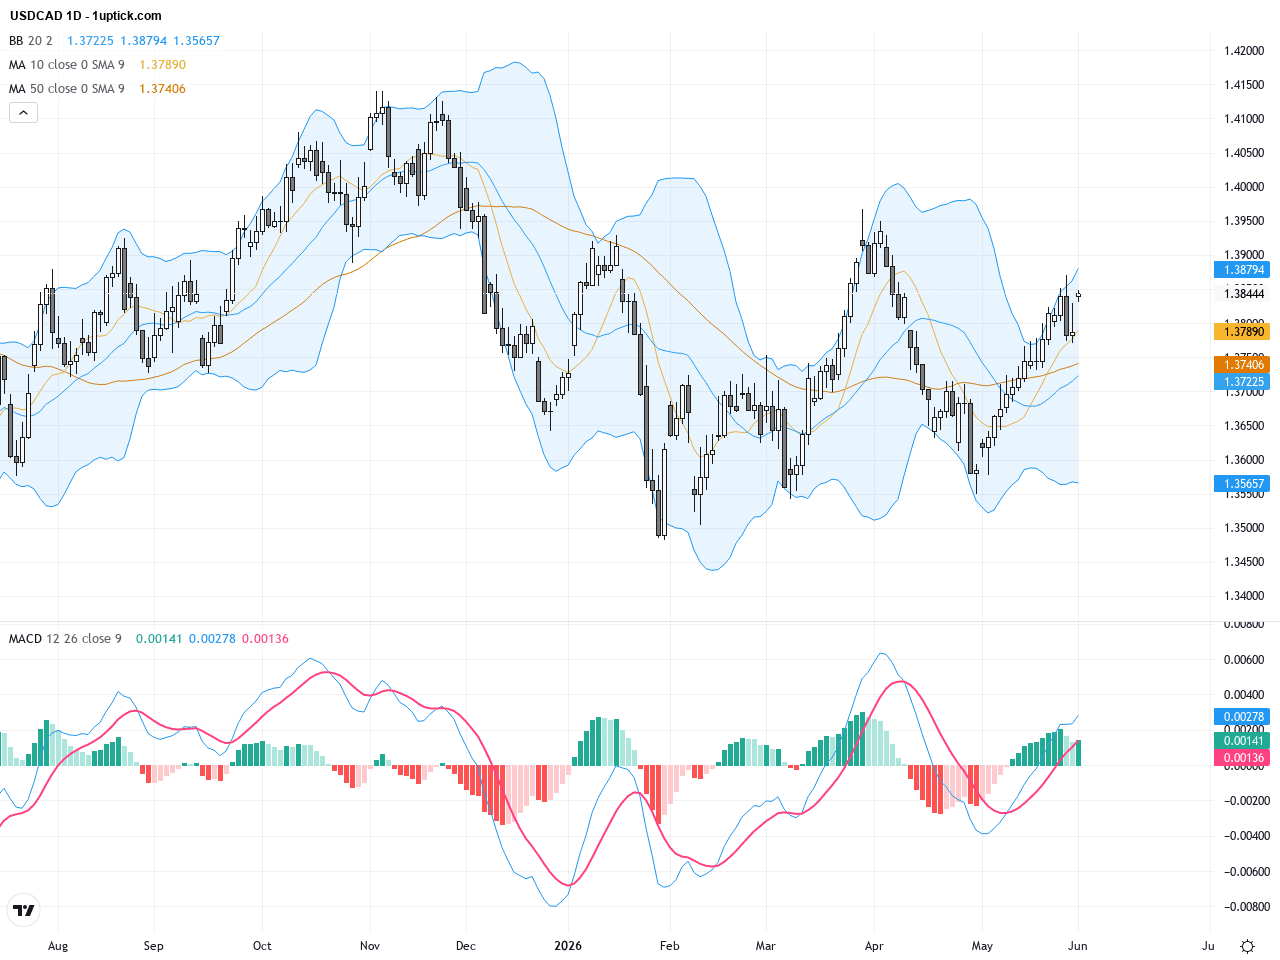
The daily chart reveals that USDCAD has maintained a gradual uptrend since early this year, recently consolidating within the 1.37 to 1.39 range. The price sits near 1.384, comfortably above the 50-day simple moving average (around 1.3737), indicating strengthening medium-term bullish momentum. The Bollinger Bands are widening with an upward tilt, suggesting increased volatility and room for further upside. The MACD shows a bullish crossover, implying rising momentum, though the RSI remains in a neutral-to-slightly-overbought zone, hinting at possible short-term pullbacks.
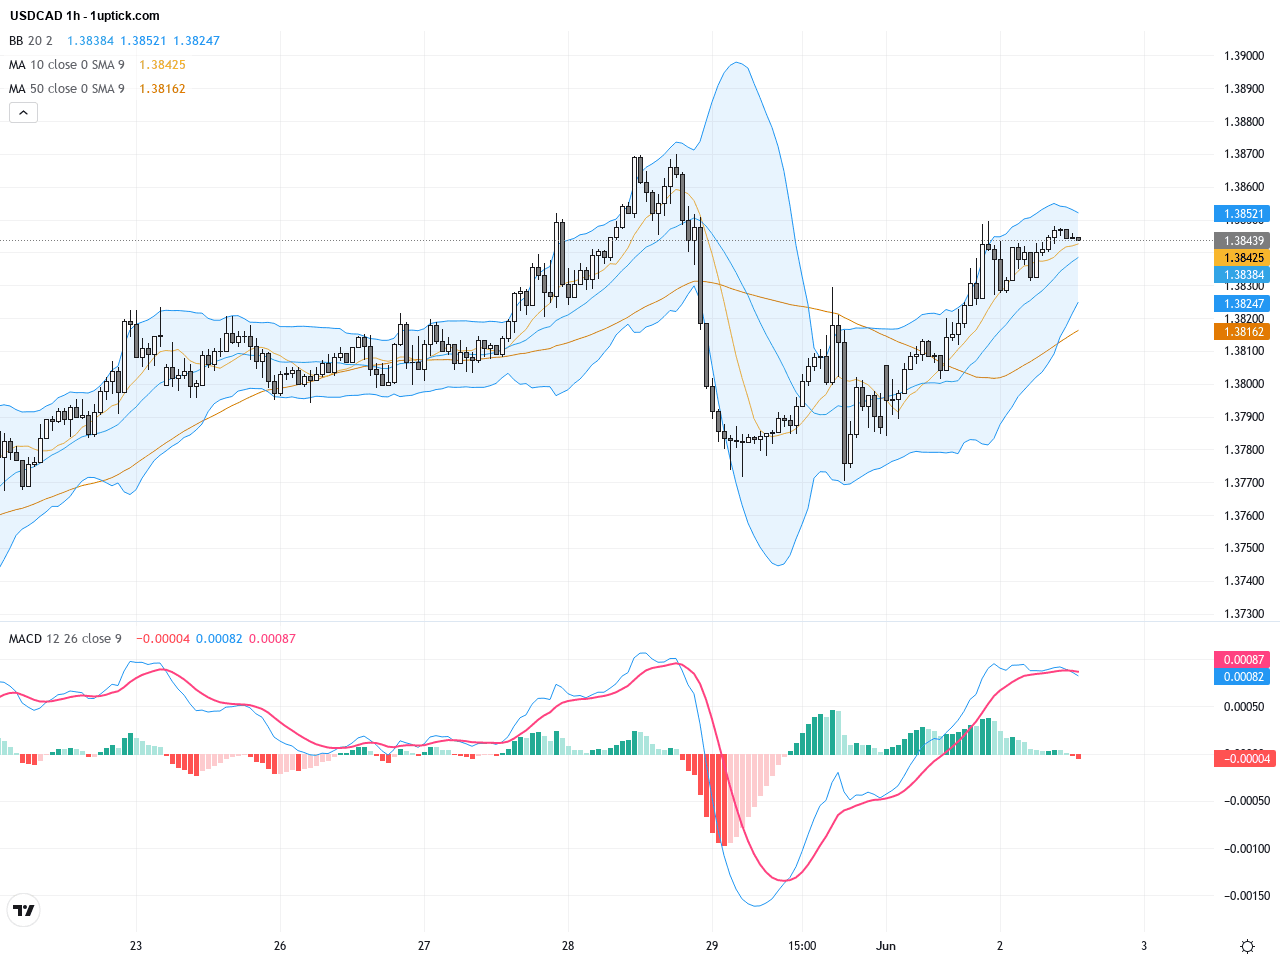
The hourly chart over the last 3-5 days indicates USDCAD has been consolidating just below 1.38 before recently breaching 1.3845. Short-term moving averages are aligned bullishly, and the price has maintained above the 20-period Bollinger Band midpoint, signaling short-term buying pressure. MACD remains bullish above the zero line with expanding momentum. Additionally, a rising flag pattern appears to be forming, which if broken to the upside, could signal a continuation of the recent rally.
Technical Trend: USDCAD is currently in a cautiously bullish trend, with gaining upward momentum but lingering short-term volatility risk.
Technically, the breakout above the 50-day SMA is the most significant event this week for USDCAD, supported by a bullish MACD cross and expanding Bollinger Bands, suggesting potential for further upward momentum. However, oil price fluctuations and geopolitical risks add uncertainty to this outlook. The currently forming rising flag pattern offers a high-probability bullish continuation setup if confirmed. Overall, traders should remain cautiously optimistic and utilize key support and resistance levels to manage risk effectively.There are no major economic releases today (GMT+1) directly impacting USDCAD. Key attention falls on the weekly API crude oil inventory data at 22:40, which could influence oil prices and indirectly affect the Canadian dollar. Other important US or Canadian economic data are not scheduled, so near-term price action will likely be driven by geopolitical developments and oil market movements.
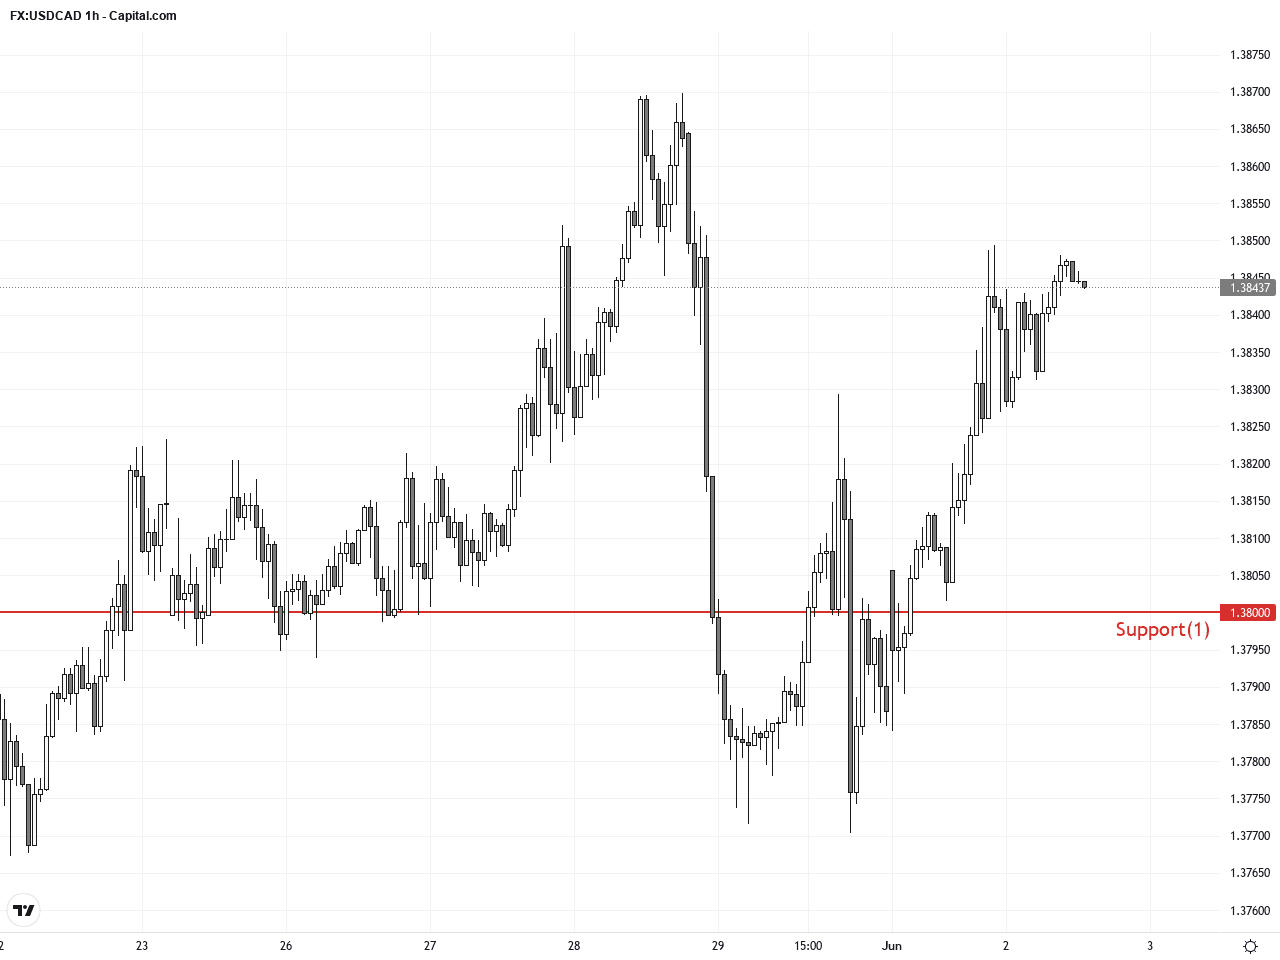
Resistance & Support
The above financial market data, quotes, charts, statistics, exchange rates, news, research, analysis, buy or sell ratings, financial education, and other information are for reference only. Before making any trades based on this information, you should consult independent professional advice to verify pricing data or obtain more detailed market information. 1uptick.com should not be regarded as soliciting any subscriber or visitor to execute any trade. You are solely responsible for all of your own trading decisions.