 |
| Gold V.1.3.1 signal Telegram Channel (English) |
USDJPY Trading Outlook: Poised at Key Resistance Before BOJ Rate Hike Impact, June 1, 2026
2026-06-01 @ 11:01
Over the past 24 to 48 hours, the USD/JPY pair traded within the 159.2 to 159.5 range, closing yesterday at 159.461, up slightly by 0.13% from the previous day. Despite Japan’s record $73.6 billion intervention to defend the yen, the USD/JPY rate continues to test the critical 160 level, indicating ongoing pressure on the yen.
The market’s attention has been focused on the upcoming Bank of Japan (BOJ) meeting on June 16, where an interest rate hike is widely anticipated to tackle persistent inflation. This anticipated hike has provided some support for the yen, but it also raises the risk of intensified intervention. BOJ Governor Ueda’s June 3 speech is seen as a key signal, following a tight 6-3 vote on policy, suggesting a potential shift away from ultra-loose monetary policy. Investors remain cautious about yen carry trades amid this uncertainty.
For the average investor, this means USD/JPY is poised for continued volatility. On one side, expectations of a BOJ rate hike could strengthen the yen; on the other, further government market interventions to curb excessive fluctuations could inject unpredictability. In essence, it’s like riding a seesaw: exchange rates could swing noticeably based on evolving policy signals, so traders need to stay alert to intraday updates and upcoming news to adapt their strategies accordingly.

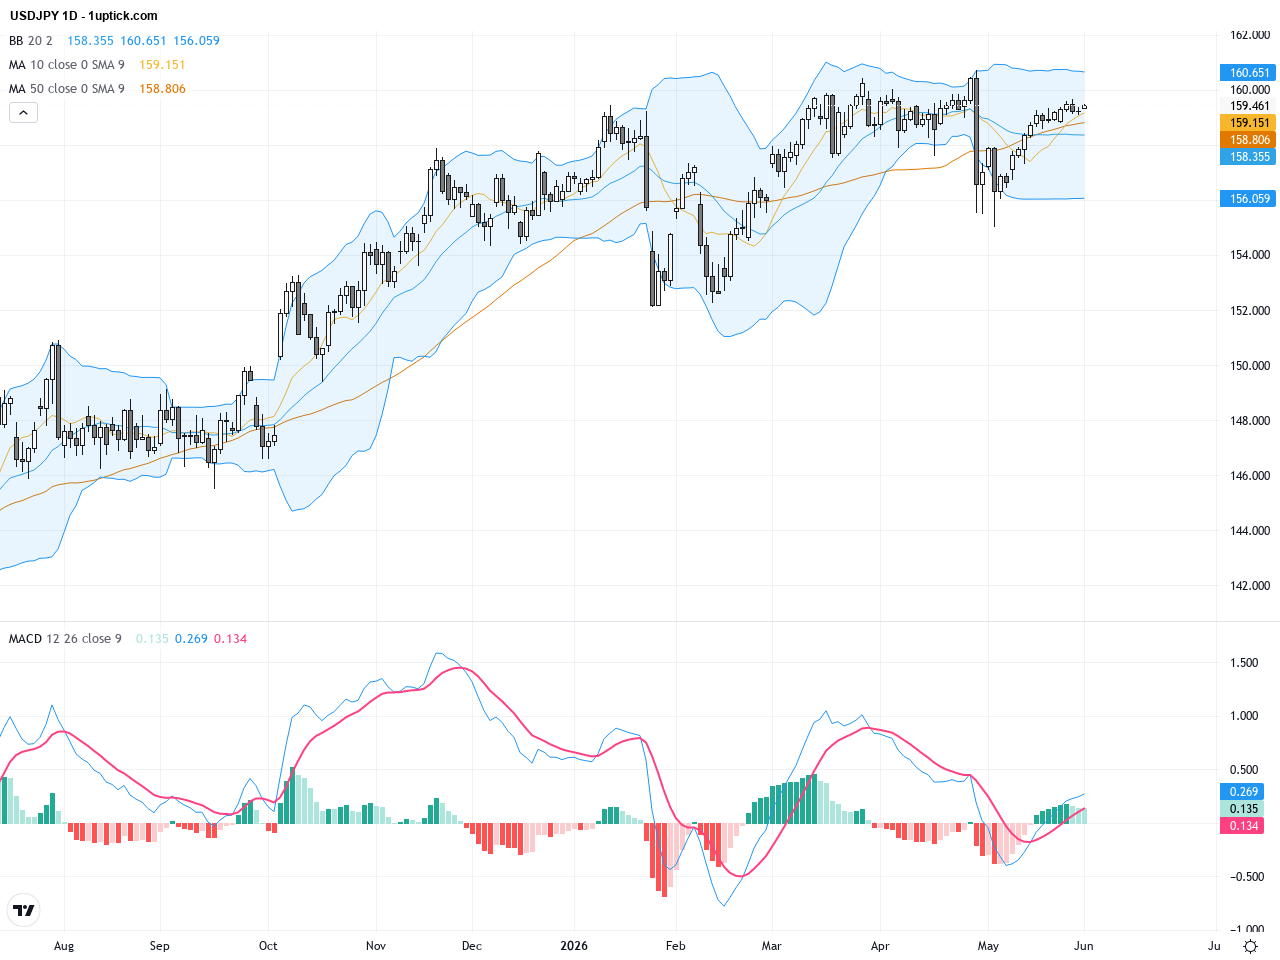
The daily chart reveals USDJPY forming a rising wedge pattern as the price steadily climbed from near 142 earlier this year. The pair is currently consolidating near 159-160 resistance levels. The 50-day moving average (~158.8) and 200-day moving average (~155) provide strong underlying support. Bollinger Bands tightening indicates diminishing volatility, suggesting an impending breakout. The MACD remains positive but with shrinking histogram bars, signaling waning bullish momentum and a possible short-term consolidation phase.
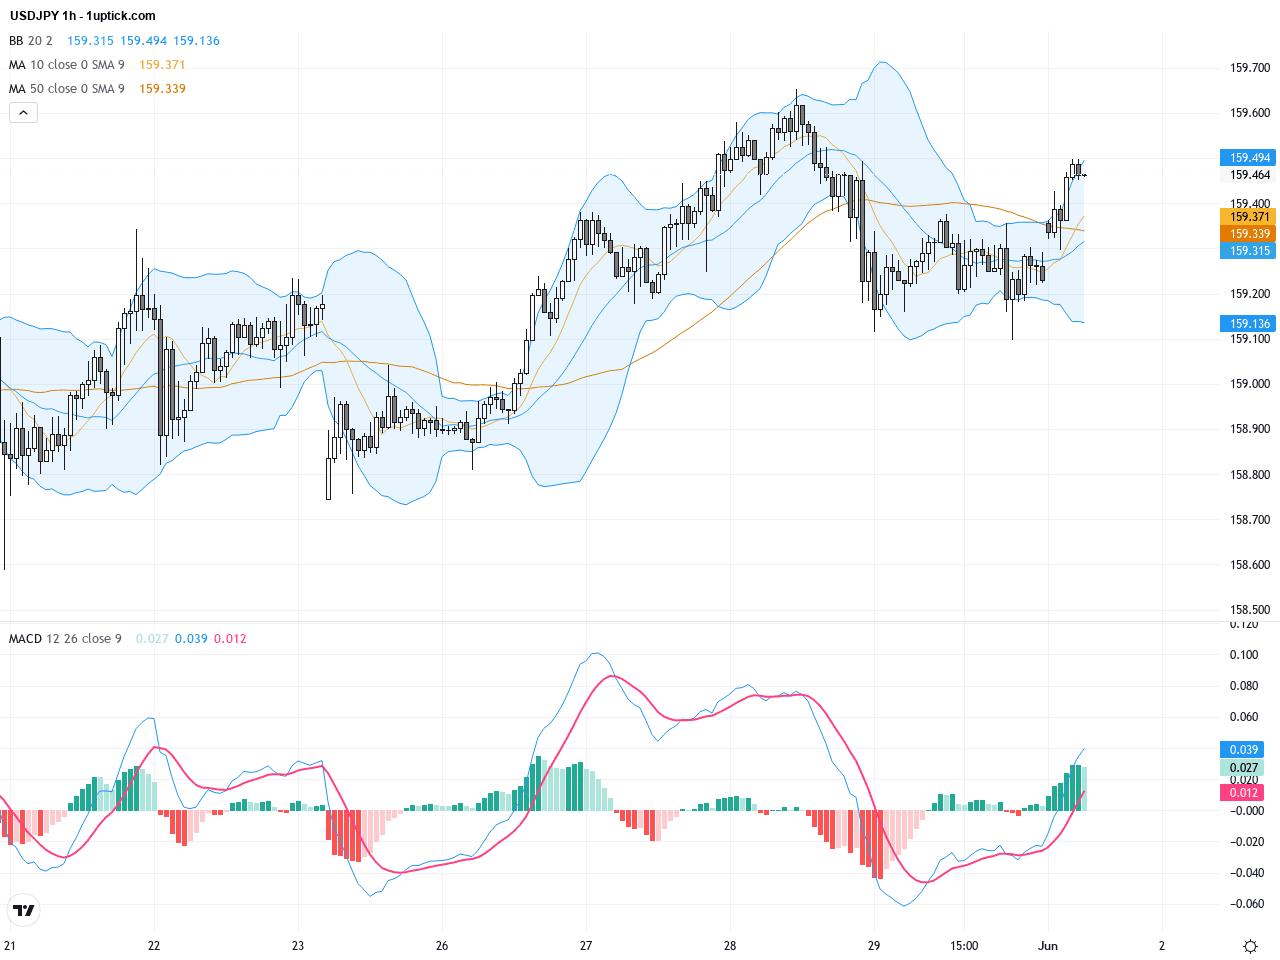
On the hourly chart, USDJPY has been oscillating between 159.8 and 160.2 over the past 3-5 days, forming a clear consolidation channel. Short-term indicators like the 20 EMA hover near 159.5, competing with resistance. Narrowing Bollinger Bands highlight an unresolved trend, while the MACD approaches a potential bullish crossover. Recent candlesticks showing hammer-like formations with long lower shadows imply buyers stepping in at lower prices, indicating short-term support strength.
Technical Trend: USDJPY currently exhibits a cautiously bullish trend, underpinned by supportive fundamentals and mostly positive technical signals, though near-term consolidation remains likely.
USDJPY is perched at a critical technical juncture near the 160 resistance. The daily rising wedge warns of a potential reversal risk, whereas the hourly MACD bullish crossover hints at a short-term rally. Heightened sensitivity to BOJ’s potential rate hike adds fuel to upward momentum, but failure to decisively break above 160 could prompt a pullback. Traders should monitor breakout volume and MACD signals closely for timely trade entries or exits.Today’s GMT+1 economic calendar features Japan’s May Manufacturing PMI holding steady at 54.5, aligning with expectations and exerting limited immediate influence on USDJPY. FOMC member Powell’s speech slated later could impact USD sentiment, but no direct major data releases scheduled today heavily affecting USDJPY dynamics.
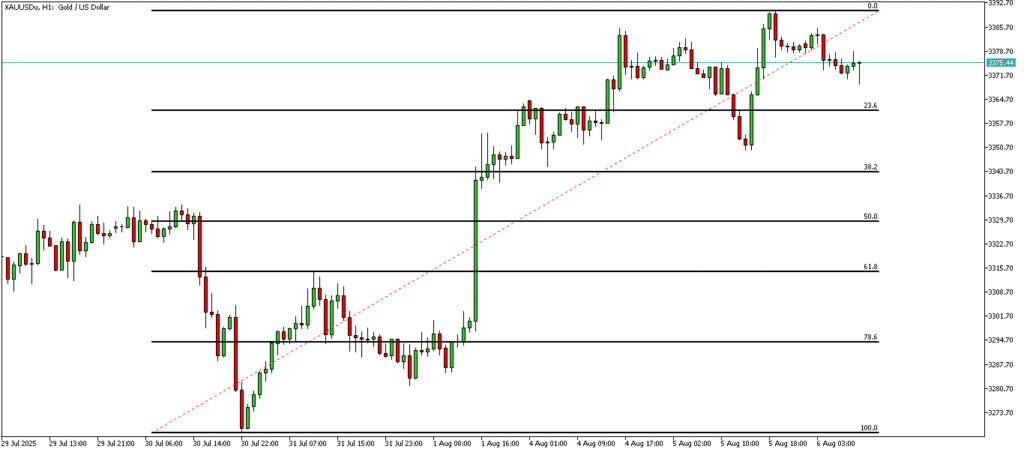
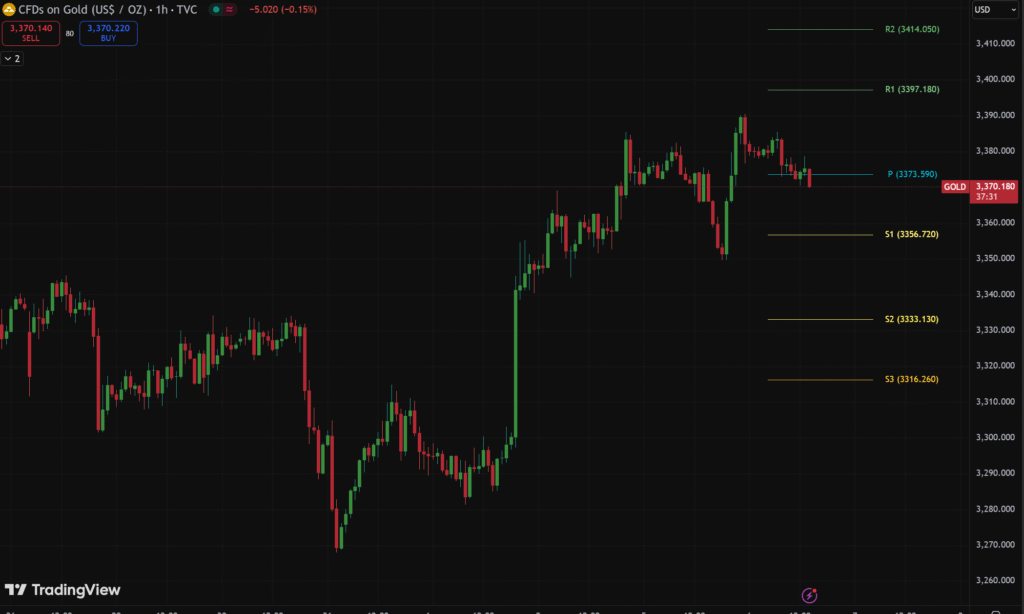
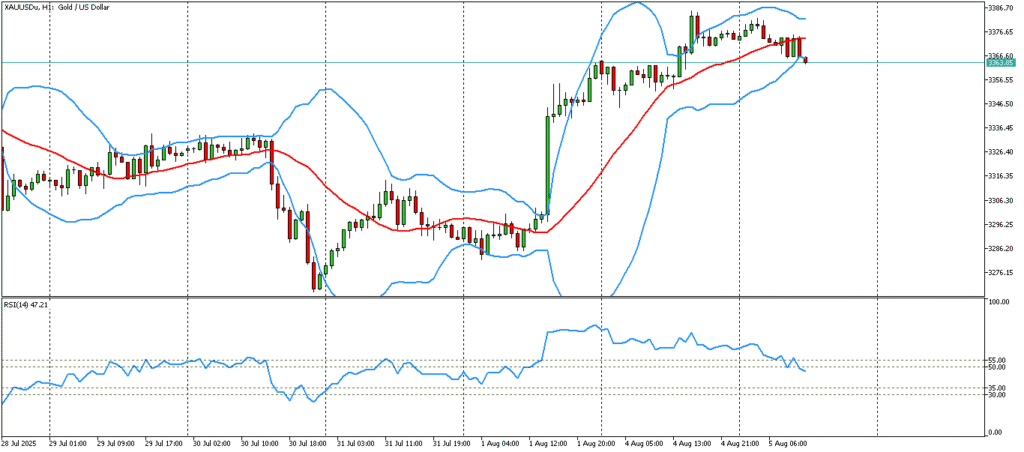
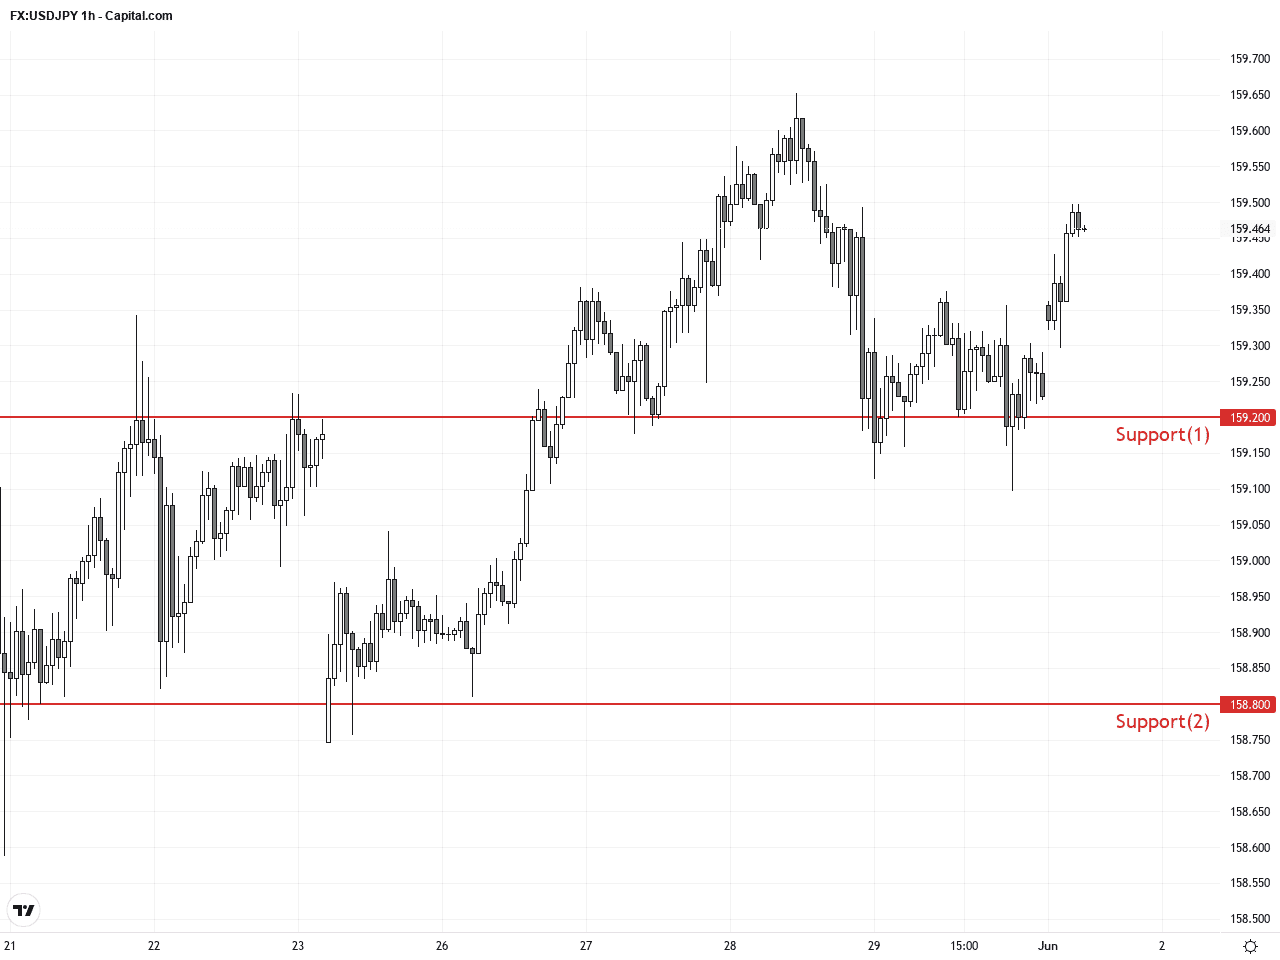
Resistance & Support
The above financial market data, quotes, charts, statistics, exchange rates, news, research, analysis, buy or sell ratings, financial education, and other information are for reference only. Before making any trades based on this information, you should consult independent professional advice to verify pricing data or obtain more detailed market information. 1uptick.com should not be regarded as soliciting any subscriber or visitor to execute any trade. You are solely responsible for all of your own trading decisions.