 |
| Gold V.1.3.1 signal Telegram Channel (English) |
WTI Crude Oil: Middle East Tensions Propel Prices Near Key Resistance, June 4, 2026
2026-06-04 @ 06:04
Over the past 24 to 48 hours, WTI crude oil prices have steadily climbed from the June 3 closing price of $96.02, reaching near a two-week high. This rally is primarily driven by escalating tensions in the Middle East, particularly renewed clashes between the US and Iran, sparking market jitters and increasing demand for crude oil as a safe haven. Additionally, data from the Energy Information Administration (EIA) revealed continuing declines in oil inventories, heightening concerns over supply constraints. The rising oil prices have also put pressure on equity markets, with the S&P 500 and Dow Jones indices retreating, reflecting the disruptive impact of geopolitical risks on investor sentiment.
For the average investor, the rise in WTI crude oil prices acts as a “red flag” of geopolitical uncertainty, turning what was a steady market into a volatile one. Energy stocks and sectors could benefit from these price movements, but there is also the risk that rising energy costs may weigh on global economic growth. The US dollar’s recent strength, driven by robust economic reports, imposes some pressure on crude prices, yet the uncertainty surrounding US-Iran tensions currently dominates the market dynamics.
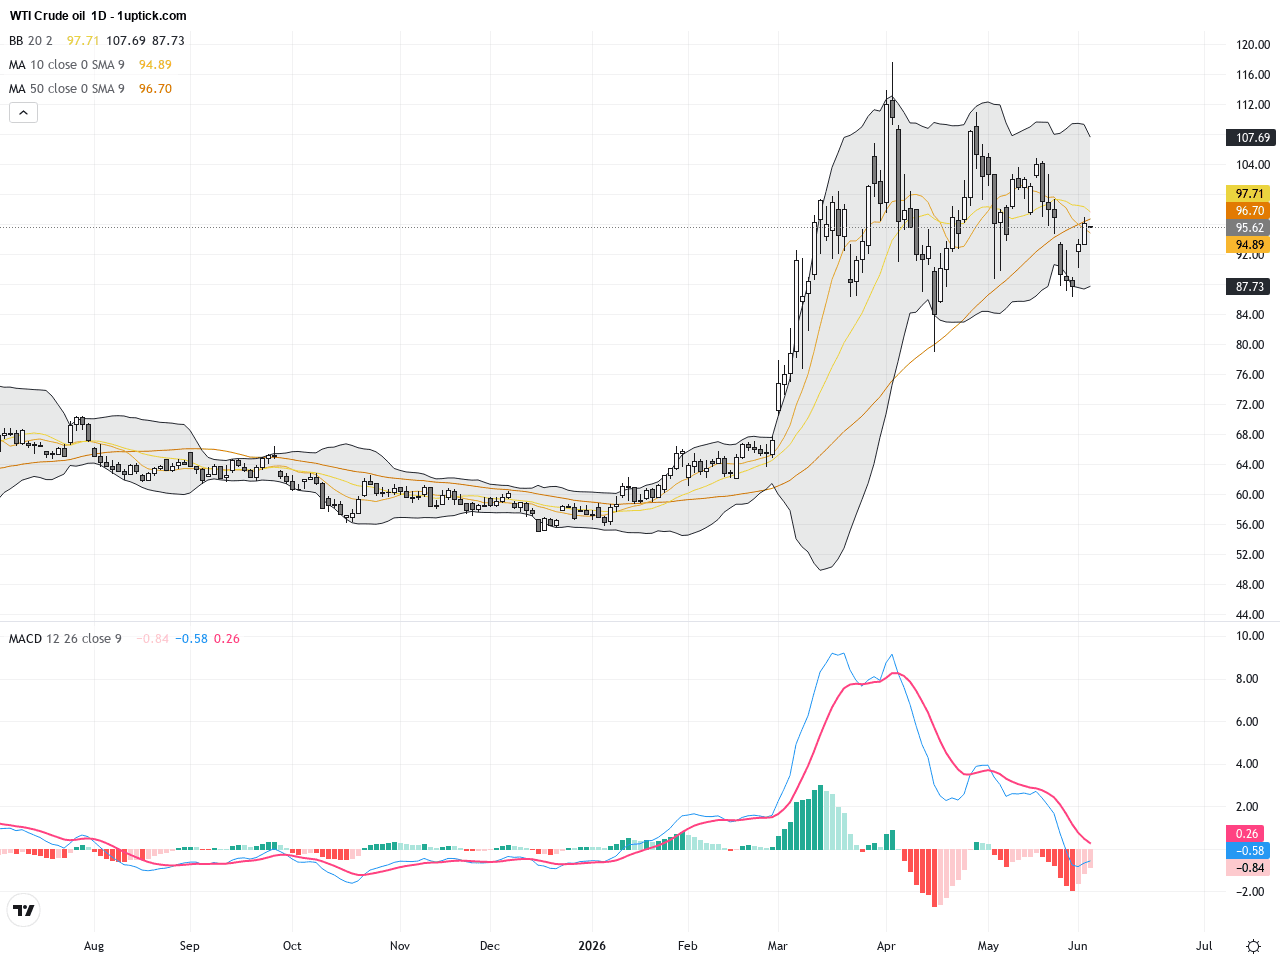
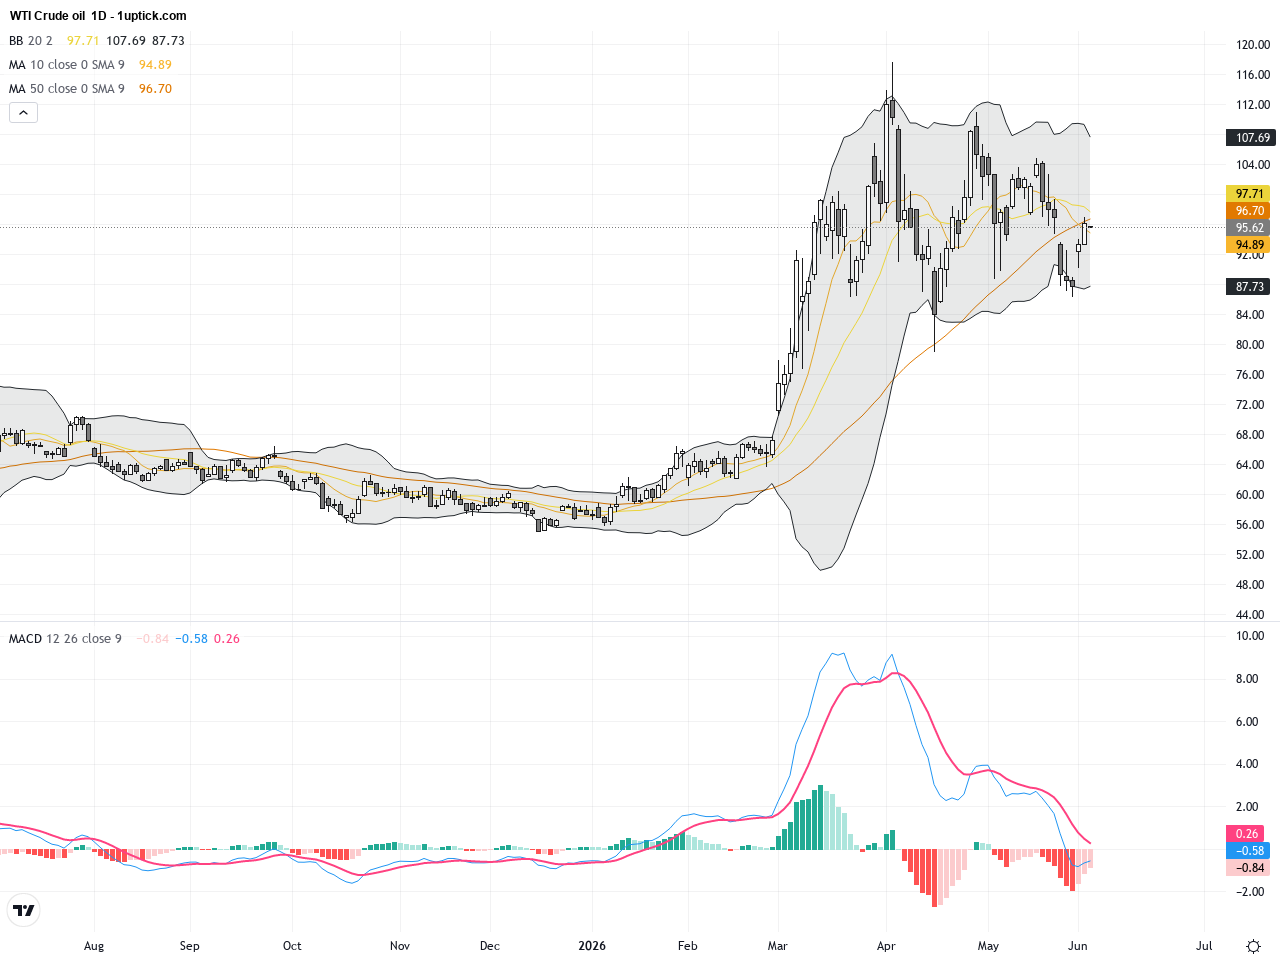
The daily chart shows a clear bullish uptrend in WTI Crude Oil prices recently. Price has broken through short-term resistance zones, forming higher highs and higher lows. Moving averages are aligned bullishly, with short-term MAs crossing above long-term MAs, indicating trend strength. Bollinger Bands are expanding, signaling increased volatility. The MACD’s fast line is rising above the zero line, confirming strong upward momentum. Overall, the daily chart supports further potentially upward moves in the near future.
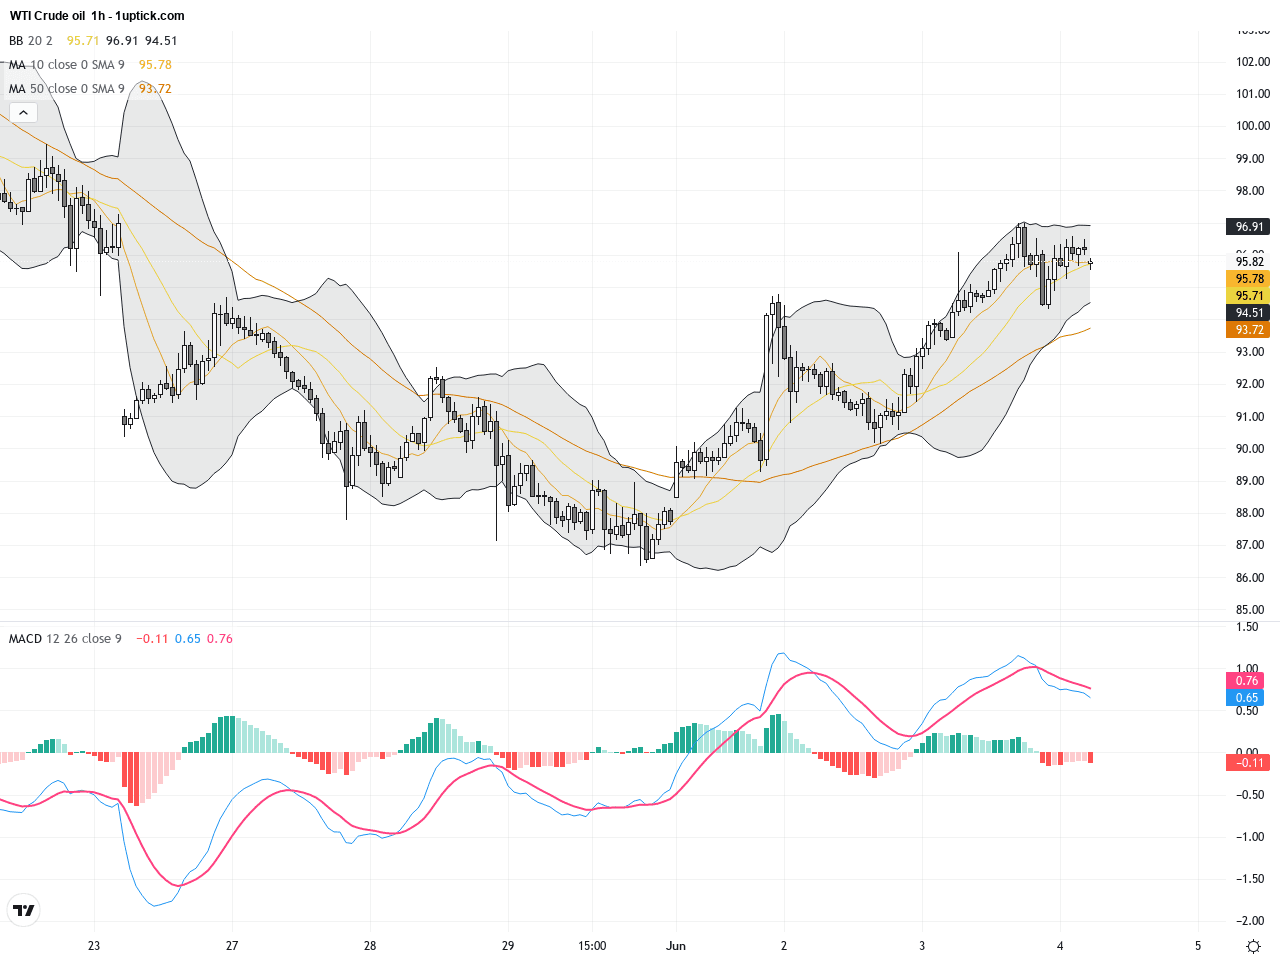
On the hourly chart, WTI Crude Oil exhibits a volatile but upward pattern over the last 3-5 days. Price tests and holds near the upper Bollinger Band repeatedly. Short-term moving averages trend upward with price above these averages. A recent MACD bullish crossover accompanied by RSI near 70 indicates strong buying momentum but also warns of possible overbought conditions. The latest engulfing candlestick suggests a short-term pullback might occur, though the primary bullish pattern remains intact.
Technical Trend: Bullish with consolidation
Technically, WTI Crude Oil is displaying a bullish trend with daily chart resistance levels in focus. The MACD golden cross and expanding Bollinger Bands suggest strong buying pressure, while short-term hourly chart overbought signals and engulfing candle patterns advise caution for a possible minor correction or consolidation. Maintaining above $95 will likely confirm the strong bullish stance and attract trend followers.There are no major economic events scheduled today that directly impact WTI Crude Oil prices. Traders should instead focus on ongoing geopolitical developments in the Middle East and upcoming US inventory reports for potential market moves.
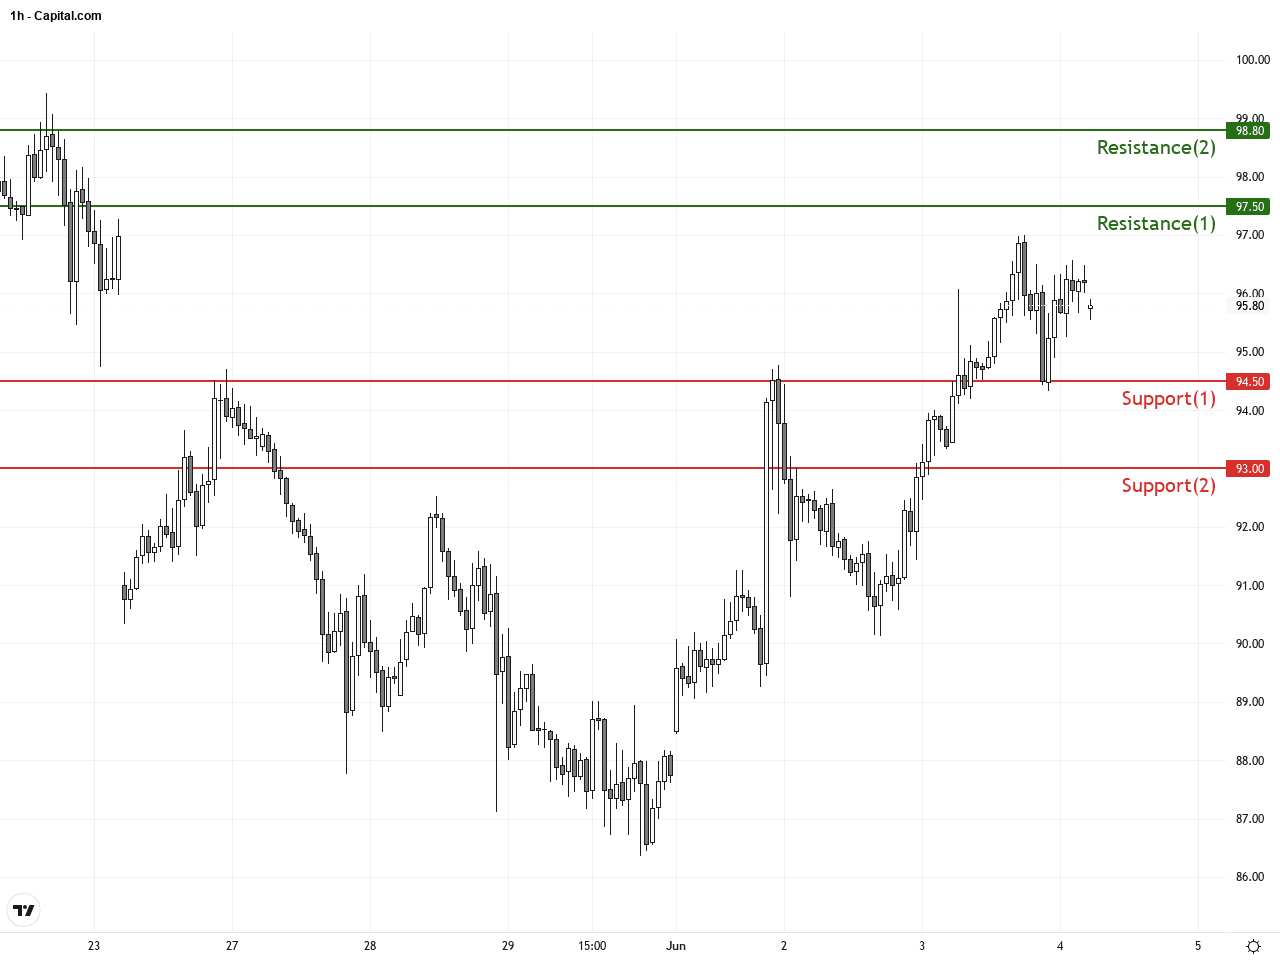
Resistance & Support
The above financial market data, quotes, charts, statistics, exchange rates, news, research, analysis, buy or sell ratings, financial education, and other information are for reference only. Before making any trades based on this information, you should consult independent professional advice to verify pricing data or obtain more detailed market information. 1uptick.com should not be regarded as soliciting any subscriber or visitor to execute any trade. You are solely responsible for all of your own trading decisions.