 |
| Gold V.1.3.1 signal Telegram Channel (English) |
XAUUSD: Key Technical Patterns and Market News Driving Gold Price This Week, June 2, 2026
2026-06-02 @ 05:10
Over the past 24 to 48 hours, gold prices (XAUUSD) experienced notable volatility, closing yesterday at $4483.845, marking a decline from the previous day. Rising US Treasury yields pressured gold as bond traders grew concerned that surging oil prices might force the Federal Reserve to hike rates again, dampening gold’s appeal as a safe haven.
However, several key developments influenced price action. Reports of a US-Iran ceasefire deal spurred a rebound from a two-month low, while weaker-than-expected Personal Consumption Expenditure (PCE) data helped gold stabilize by easing inflation worries.
These factors created a complex dynamic: on one side, climbing bond yields weighed on gold, while on the other, improving geopolitical outlook and cooling inflation provided support. For the average investor, this period resembles a tug-of-war — with bond and oil markets trying to push gold lower, while hopes for peace and easing inflation underpin its value.
Looking ahead, this week is critical with employment (NFP) and ISM manufacturing data on the horizon. Market anticipation around Federal Reserve policy will likely continue driving gold’s price swings. Investors should closely monitor these macro data points to gauge the upcoming direction of the gold market.

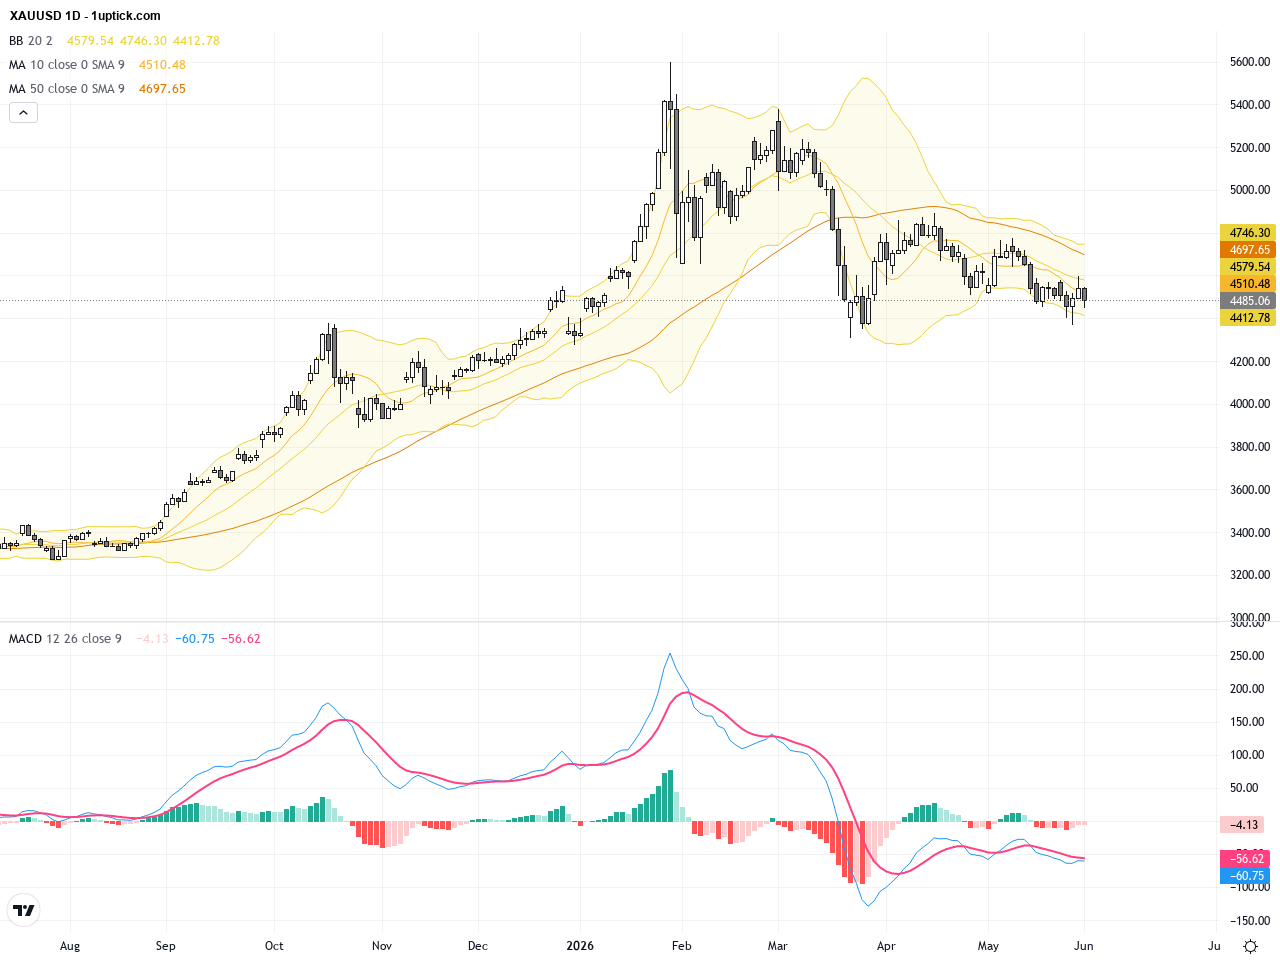
The daily chart shows XAUUSD retreating from highs near 4550-4580 in a corrective pullback phase. Moving averages show a recent bearish crossover, signaling mounting downward pressure. Bollinger Bands contraction suggests volatility is tightening, while MACD remains in negative territory, reinforcing the bearish momentum. The price is currently testing support zones, indicating that cautious attention is warranted for possible rebounds or further declines. Long-term trend context suggests the market is digesting previous gains and determining the next major move.
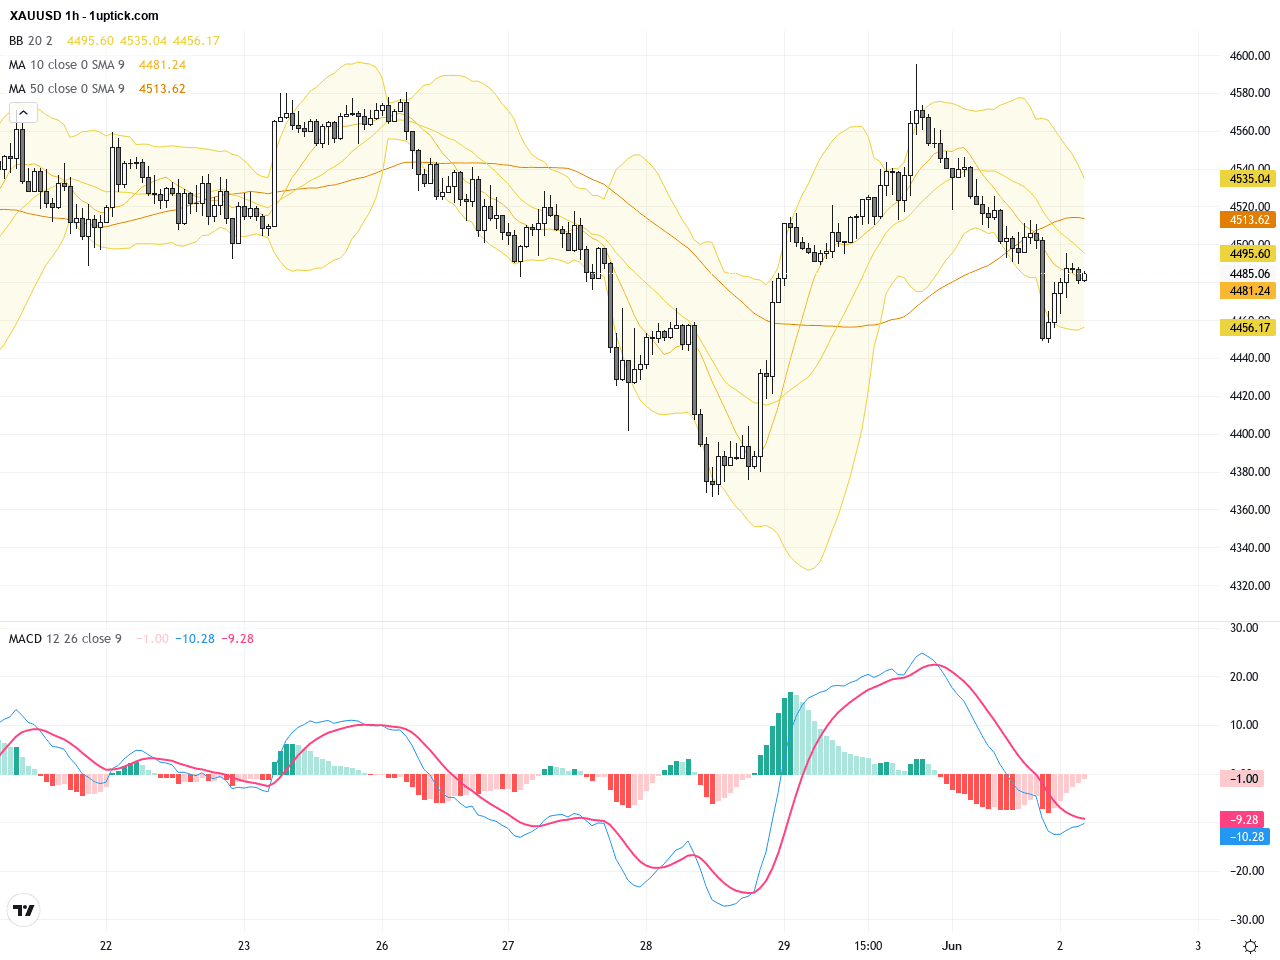
On the hourly chart spanning the last 3 to 5 days, XAUUSD oscillates around the Bollinger Bands midline, encountering resistance at moving averages. A recent death cross formed between the 50 and 200-hour MAs points to short-term bearish momentum. MACD histogram and signal lines trend downward, while RSI hovers near oversold levels around 30, indicating a potential short-term bounce but overall consolidative bearish tone. A descending triangle pattern is apparent, which if confirmed via breakdown, could deepen the near-term decline.
Technical Trend: XAUUSD currently exhibits a cautiously bearish trend with heightened volatility and sideway consolidation.
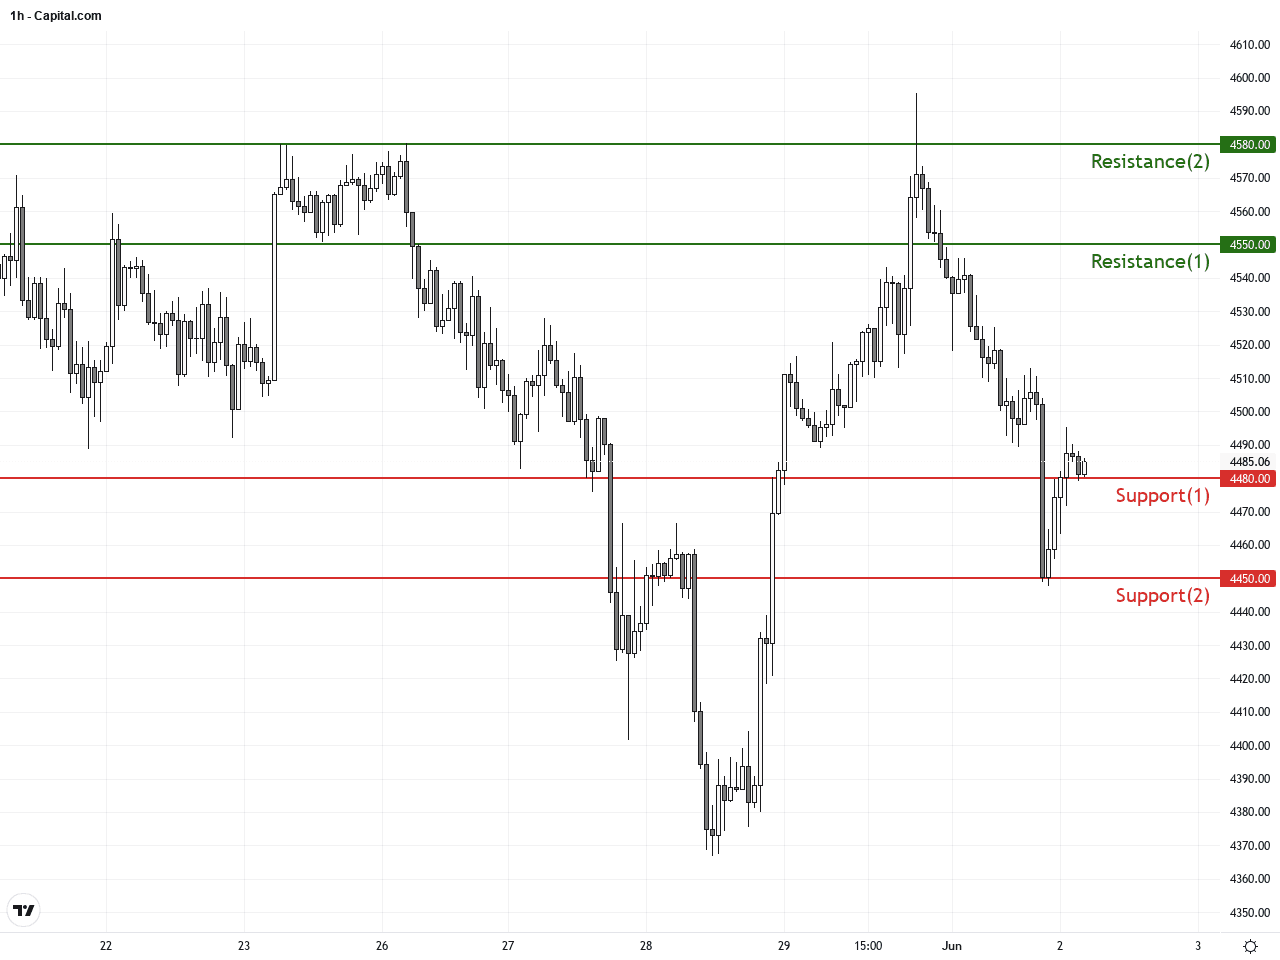
Technical insights reveal XAUUSD at a crucial juncture, with daily MACD and moving averages indicating medium-term bearish conditions contrasted by short-term bullish candlestick patterns such as a recent bullish engulfing pattern. The ongoing descending triangle pattern warns of potential breakdown below key support at 4500, with downside targets near 4450 and 4400. Volume should be closely monitored to confirm any breakout direction, as high-volume moves tend to validate trend changes. Traders are advised to weigh both momentum signals and pattern breakouts when planning trades.Today’s economic calendar features several key manufacturing PMI and ISM releases from the US and major economies, scheduled in the afternoon and early evening Hong Kong time. These data points are pivotal for XAUUSD because they influence USD strength and Fed rate expectations, which in turn affect gold prices. Should US ISM manufacturing data exceed forecasts, USD might strengthen, placing pressure on gold. Conversely, weaker data could support gold prices. Overall, today’s events serve as a critical catalyst for short-term XAUUSD price action, requiring investor vigilance.
Resistance & Support
The above financial market data, quotes, charts, statistics, exchange rates, news, research, analysis, buy or sell ratings, financial education, and other information are for reference only. Before making any trades based on this information, you should consult independent professional advice to verify pricing data or obtain more detailed market information. 1uptick.com should not be regarded as soliciting any subscriber or visitor to execute any trade. You are solely responsible for all of your own trading decisions.