


 |
| Gold V.1.3.1 signal Telegram Channel (English) |
AUDUSD Technical Pullback Hits 200-Day EMA: Trading Outlook and Key Support & Resistance Levels, July 3, 2026
2026-07-03 @ 06:01
Over the past 24 to 48 hours, the Australian Dollar against the US Dollar (AUD/USD) remained under pressure, extending its downward trend seen throughout June. It closed yesterday at 0.6918, close to the previous session’s level, indicating short-term consolidation. Recent market news highlights that the upcoming Reserve Bank of Australia (RBA) minutes and the US Non-Farm Payrolls (NFP) report will be key drivers shaping the currency’s next moves.
Specifically, June ended on a weak note, with AUD/USD fluctuating in the 0.69 to 0.70 range year-to-date as market focus shifted from geopolitical risks back to monetary policy and economic data. Mixed Australian inflation data coupled with a strong US Dollar rebound have added pressure, forcing AUD/USD to test the support near its 200-day moving average. RBA Governor Bullock’s emphasis on a data-dependent approach has kept markets cautious regarding future rate decisions.
For everyday investors, this means the AUD currently faces significant uncertainty, where economic data releases will directly influence monetary policy direction, thus impacting exchange rate swings. Investors should pay close attention to the forthcoming employment report and RBA minutes; these key updates will likely dictate whether the Aussie Dollar rallies or corrects in the near term.
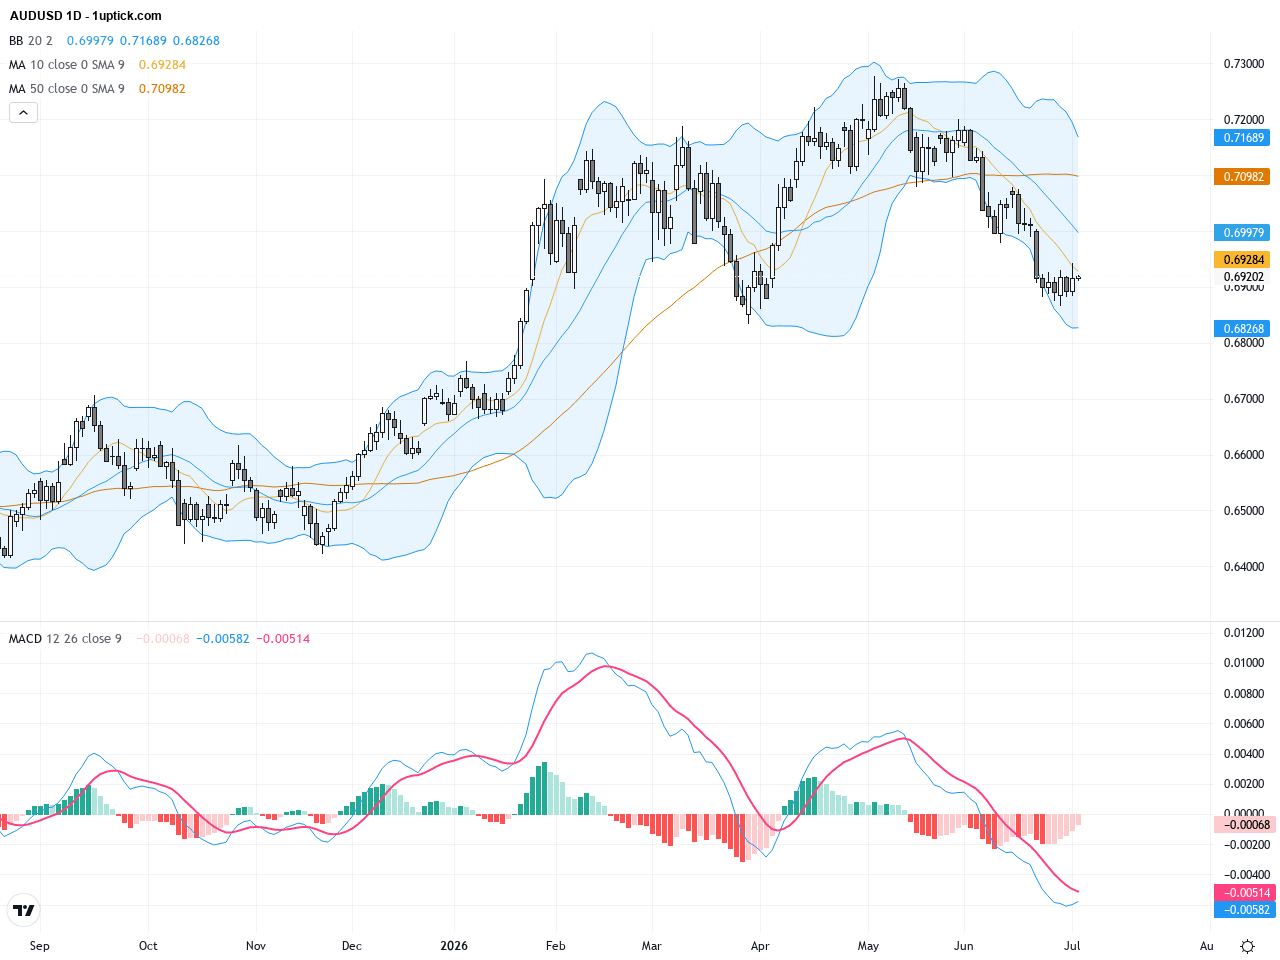
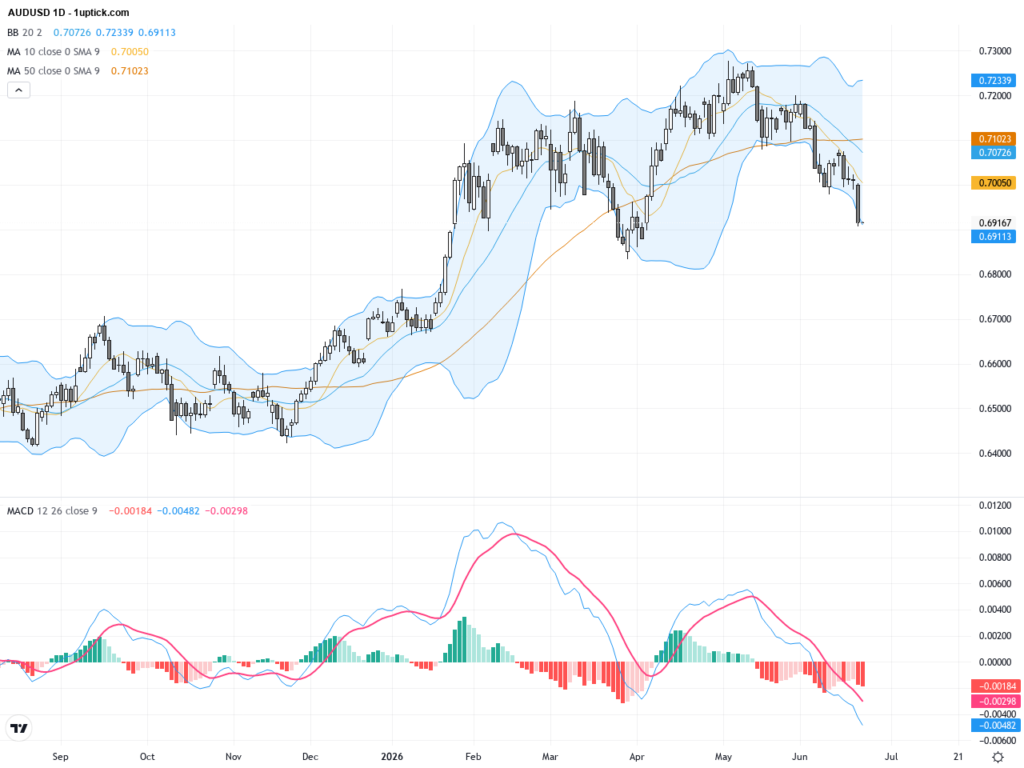
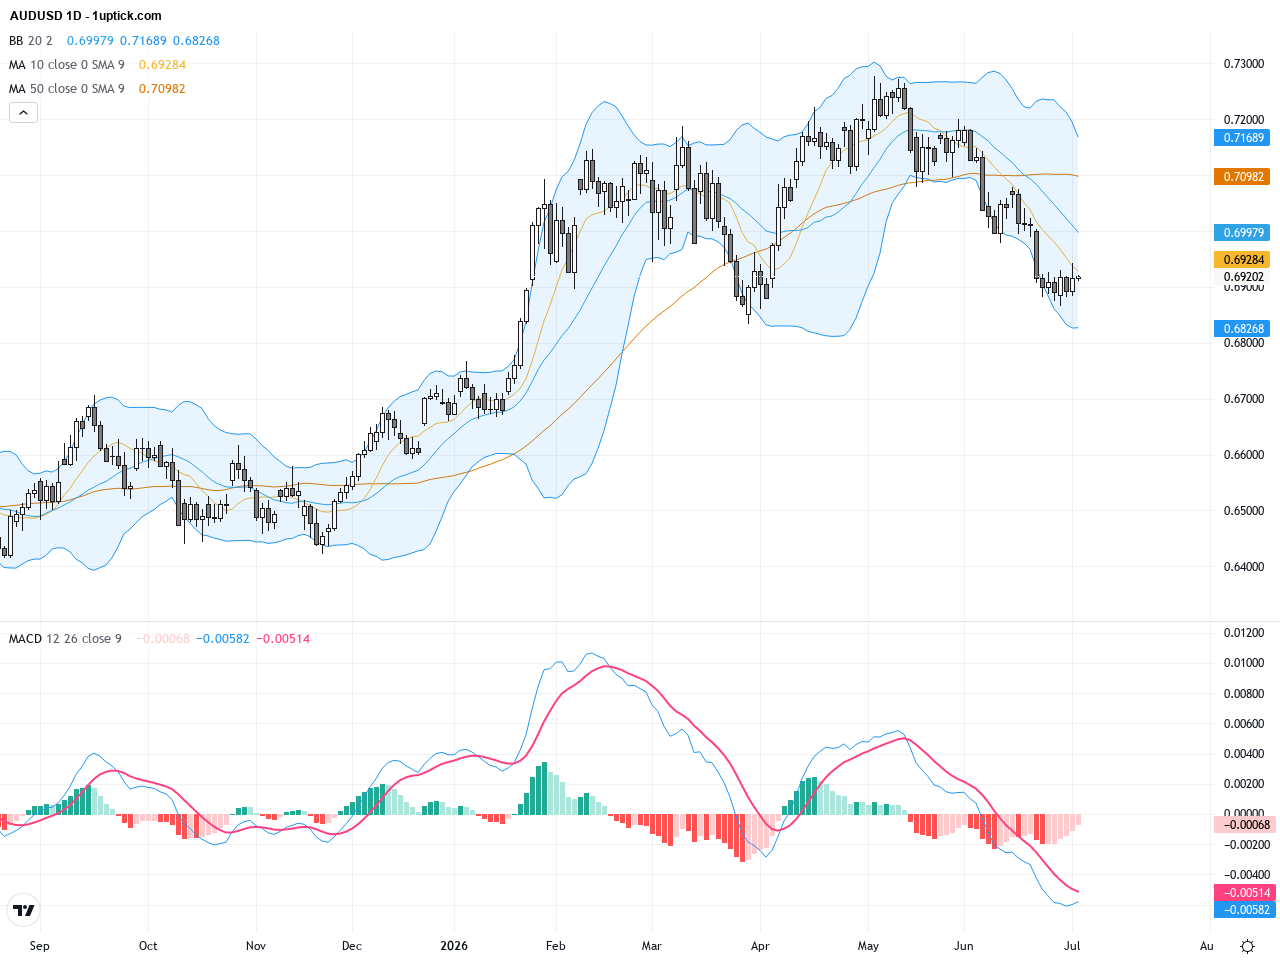
The daily chart reveals AUDUSD’s recent sharp pullback, touching the crucial 200-day EMA support at 0.68522. Since the year’s high at 0.72774, the pair has trended downward forming a medium-term bearish structure, currently fluctuating between 0.685 and 0.695. The Bollinger Bands are tightening, signaling potential increased volatility ahead. The MACD remains below zero but shows signs of convergence, indicating that selling momentum may be slowing. The 50-day moving average rests significantly above current price, acting as resistance. Overall, the daily trend remains bearish with critical support testing at the 200-day EMA.
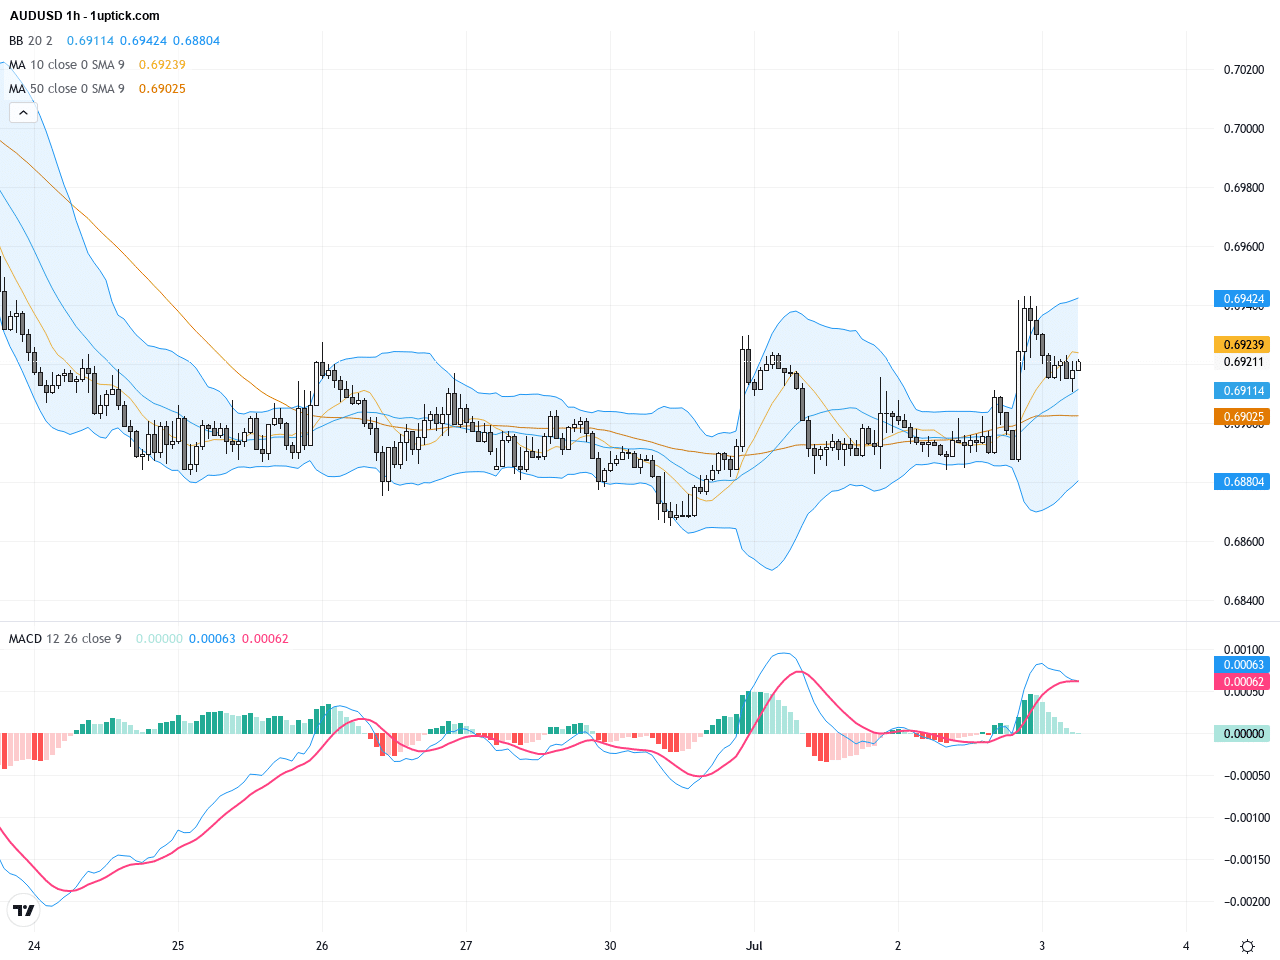
Zooming into the hourly chart over the last 3-5 days, AUDUSD shows sideways consolidation following a bounce near 0.6918, reflecting balanced short-term trading forces. Price oscillates around the Bollinger midline and repeatedly tests the 20-hour moving average support without clear breakdown, suggesting short-term buying interest remains intact. The MACD is forming a bullish crossover, with RSI near 50, indicating possible upside momentum. A small triangular consolidation pattern has emerged, which could precipitate a significant breakout. Clear resistance breakout may accelerate short-term recovery.
Technical Trend: The current trend for AUDUSD is a ‘Cautious Consolidation’ phase with a long-term bearish bias but short-term rebound signs. The market awaits critical economic data and central bank guidance to clarify the next medium-term directional move.
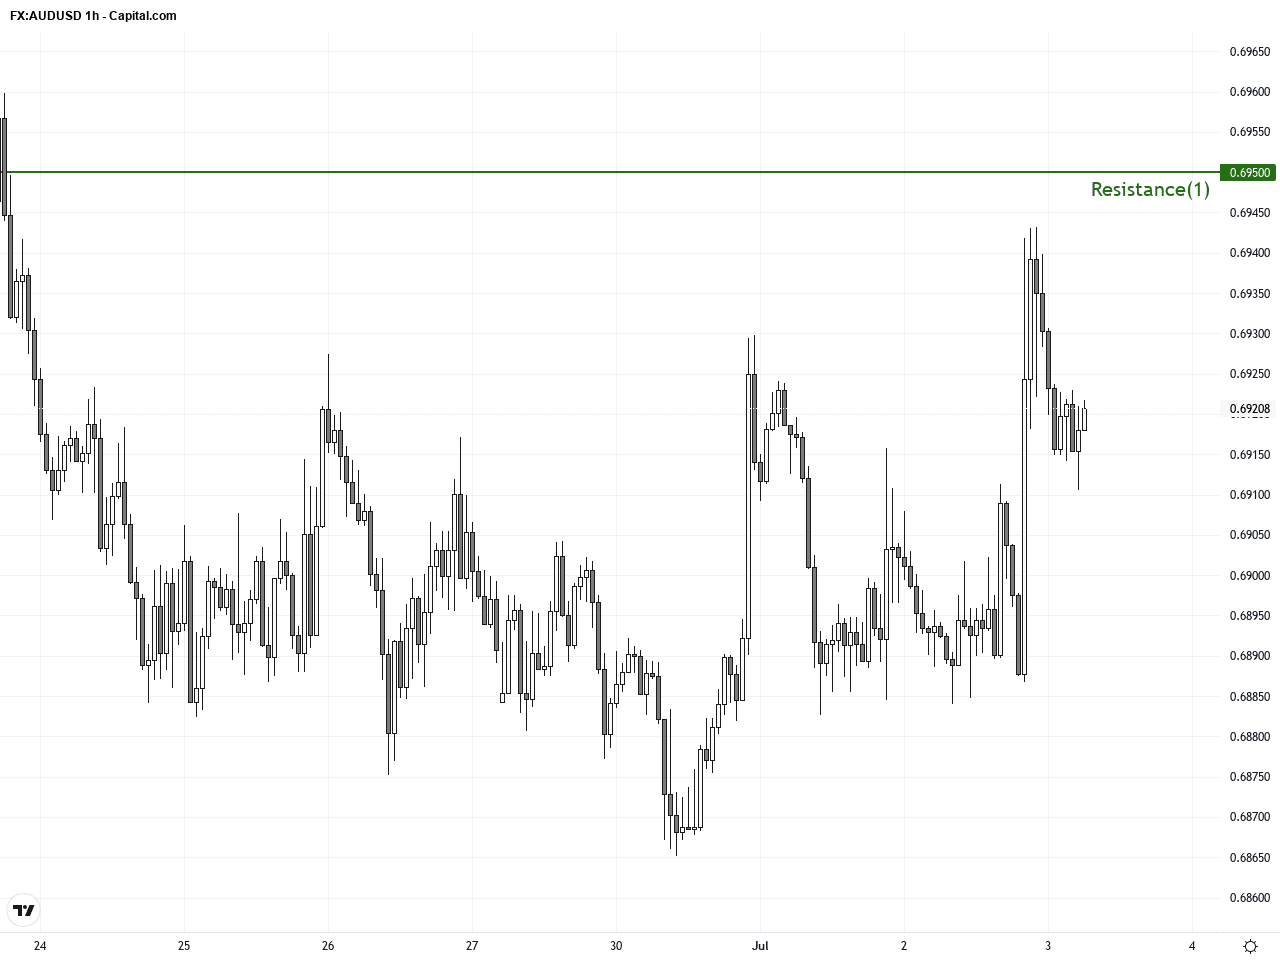
Key technical insights include the importance of the 200-day EMA support on the daily chart and the imminent bullish MACD crossover on the hourly chart. Holding above 0.685 support and breaking 0.695 resistance could signal a short-term bounce opportunity. However, the overall descending trend calls for caution against chasing rallies. The tightening Bollinger Bands suggest increased volatility ahead, so traders should watch for clear breakout confirmation to seize high-probability trade setups.Today’s economic calendar features several European and Asian services and industrial production releases but no direct major events affecting AUDUSD. Given the GMT+1 timing, these events are less likely to impact the Hong Kong-based trading session significantly. The AUDUSD pair will primarily be influenced by reactions to the upcoming RBA minutes and US Non-Farm Payroll announcements. Therefore, no significant economic data with direct impact is scheduled today for AUDUSD, and the pair’s moves will largely hinge on technical factors and broader market sentiment.
Resistance & Support
The above financial market data, quotes, charts, statistics, exchange rates, news, research, analysis, buy or sell ratings, financial education, and other information are for reference only. Before making any trades based on this information, you should consult independent professional advice to verify pricing data or obtain more detailed market information. 1uptick.com should not be regarded as soliciting any subscriber or visitor to execute any trade. You are solely responsible for all of your own trading decisions.