








 |
| Gold V.1.3.1 signal Telegram Channel (English) |
AUDUSD: Technical Rebound Driven by Softer US Jobs Data and Fed Comments Signals Strong Trading Outlook, July 8, 2026
2026-07-08 @ 06:01
Over the past 24 to 48 hours, AUD/USD has experienced significant volatility. The pair closed yesterday at 0.69219, down approximately 0.53% from the previous day. The key drivers include softer US jobs data combined with Fed Chair Warsh’s comments easing fears of aggressive interest rate hikes, resulting in a rebound from near the 200-day moving average support level. Investors responded positively, pushing the currency pair higher from its lows.
Recent US employment data surprised on the downside, reducing market bets for further aggressive Fed tightening. Warsh’s remarks reinforced this sentiment, leading to a short-term improvement in risk appetite in the forex market. For regular investors, this means the Aussie dollar has temporarily relieved prior downward pressure, boosting market confidence. Watching upcoming US and Australian macroeconomic data will be crucial to understanding future AUD/USD movements.
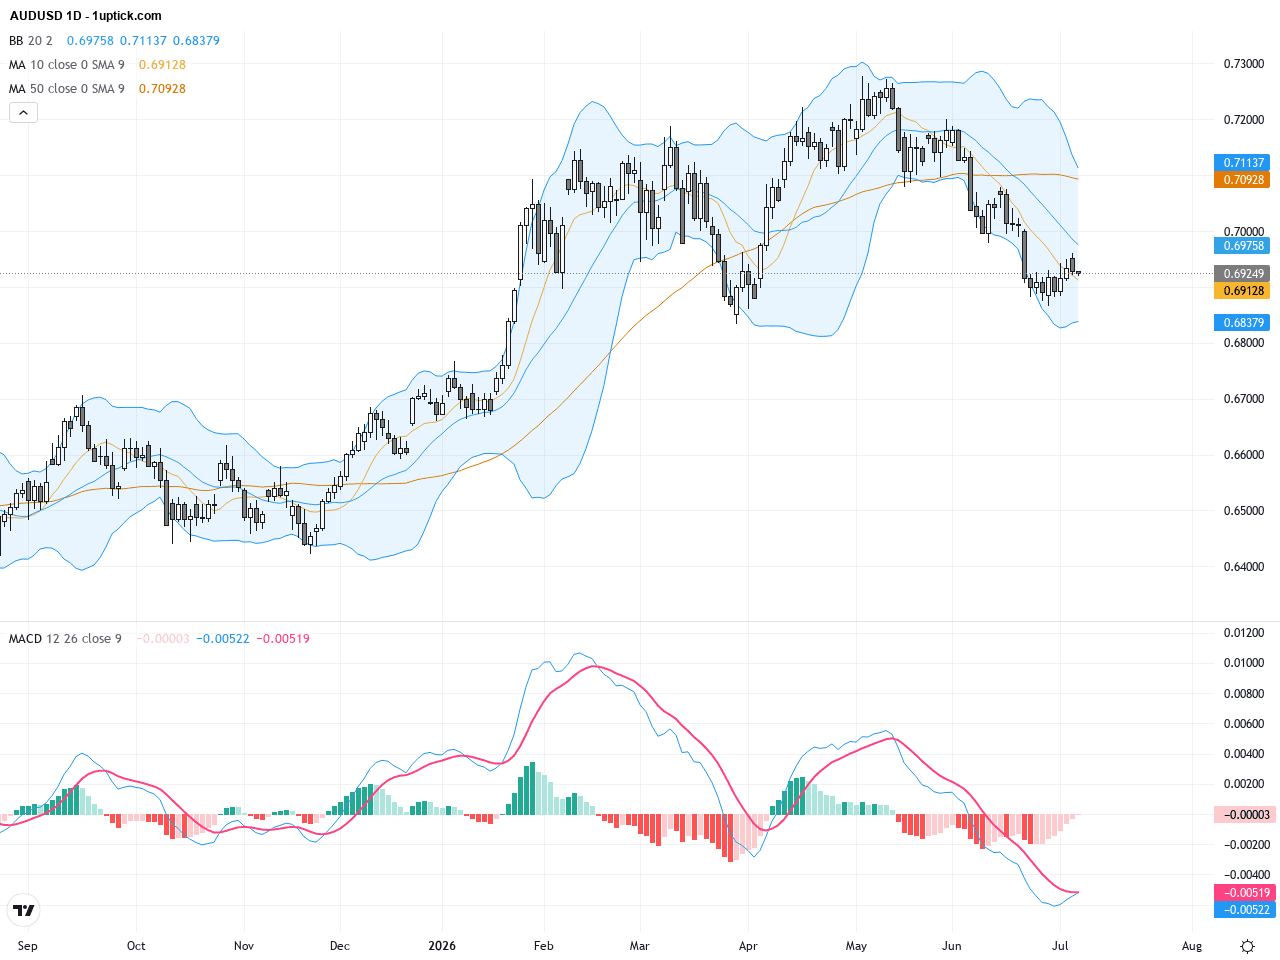
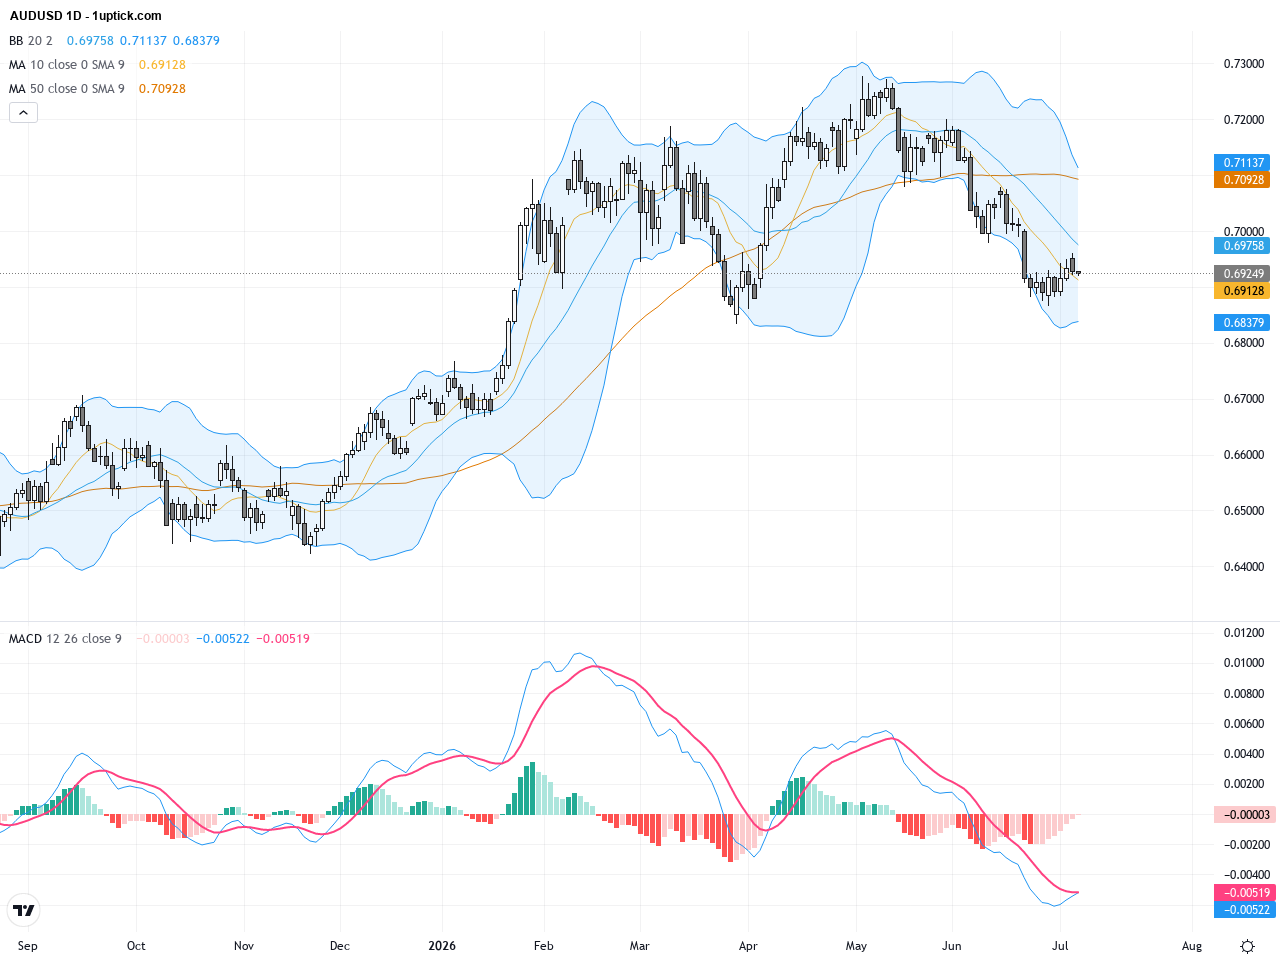
The daily chart shows AUDUSD retreating from late May highs, slipping below the 50-day moving average and finding support around the 200-day MA at 0.6857. Moving averages are mixed, reflecting medium-term uncertainty. MACD histogram indicates possible bullish momentum building, while Bollinger Bands narrow, suggesting reduced volatility. Overall, after a corrective phase, the pair may be poised for a rebound around this crucial moving average zone.
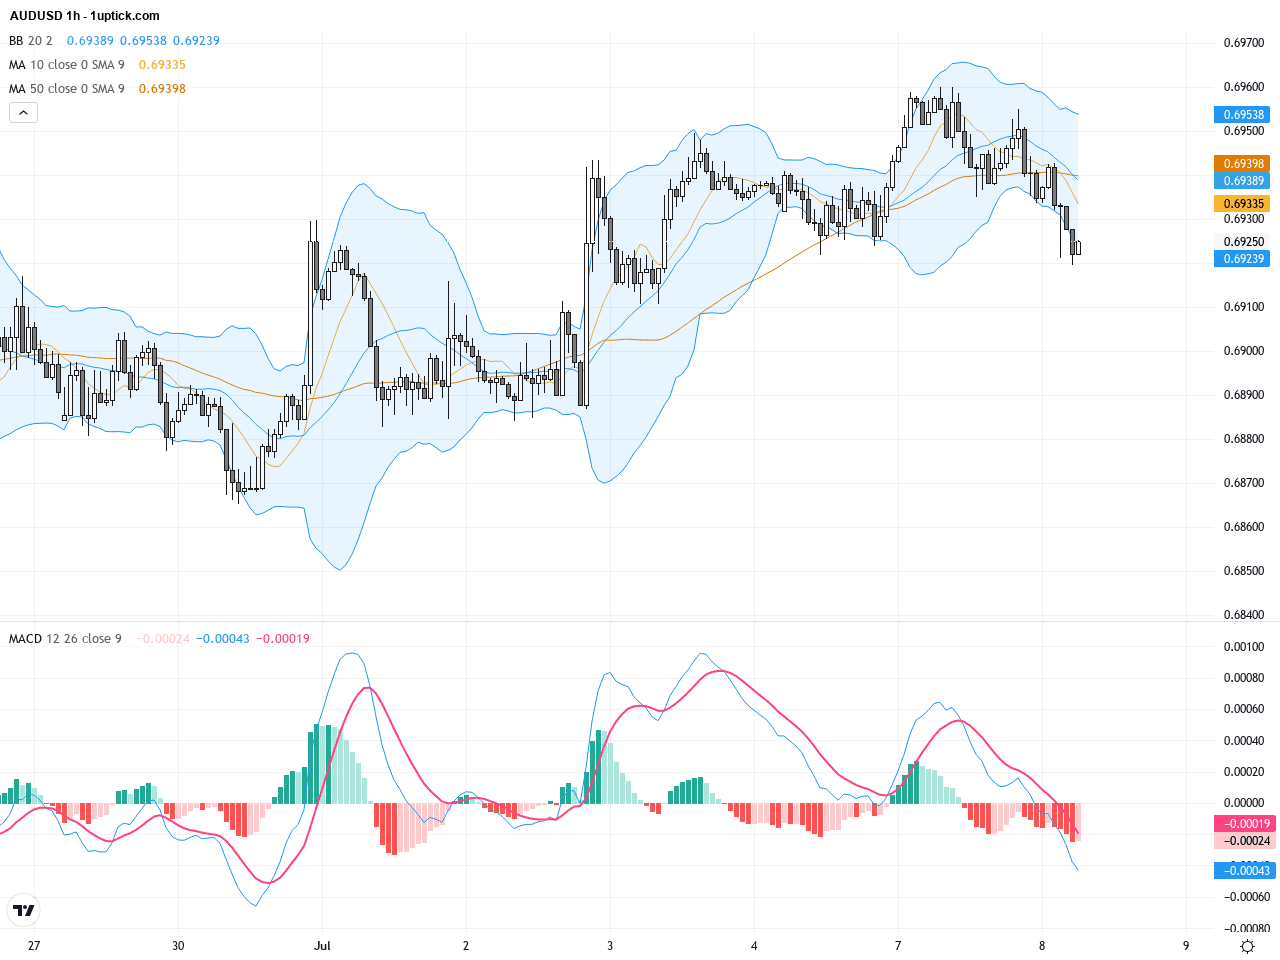
The hourly chart reveals a short-term uptrend over the last 3-5 days, with a bullish crossover of short-term moving averages emphasizing strengthening momentum. MACD and RSI indicators support a positive outlook without overbought conditions. Bollinger Bands show widening upper bands, indicating a potential breakout. A recent bullish engulfing candle suggests buying pressure could carry prices higher in the next 24 hours.
Technical Trend: Currently, the trend is cautiously bullish, with clear short-term momentum pickup, while medium-term direction remains contingent on 200-day moving average support.
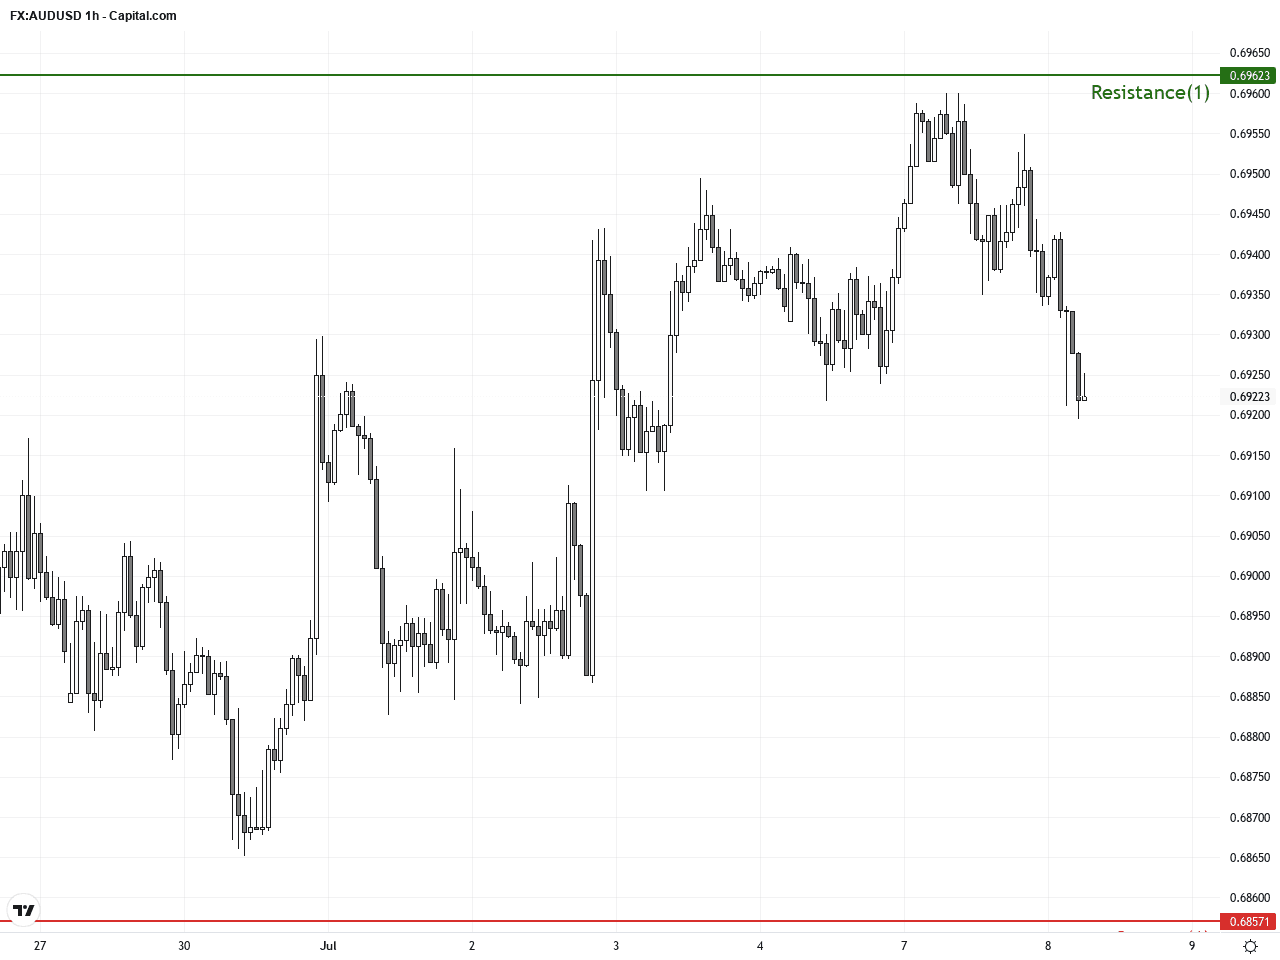
Technically, AUDUSD is supported at the critical 200-day moving average, with bullish short-term patterns like engulfing candles and moving average crossovers signaling potential entry points. The combination of softer US jobs data and dovish Fed comments fuels this rebound. Watch volume trends and MACD crossovers to confirm momentum shifts for high-probability trade setups.Today’s economic calendar features no direct Australian data impacting AUDUSD. However, several key US reports, including the trade balance, are scheduled in the evening (HK time). Better-than-expected US data could boost the dollar, pressuring AUDUSD lower, while softer data would support the Aussie. Traders should monitor volume and price action during these releases for directional cues.
Resistance & Support
The above financial market data, quotes, charts, statistics, exchange rates, news, research, analysis, buy or sell ratings, financial education, and other information are for reference only. Before making any trades based on this information, you should consult independent professional advice to verify pricing data or obtain more detailed market information. 1uptick.com should not be regarded as soliciting any subscriber or visitor to execute any trade. You are solely responsible for all of your own trading decisions.