

 |
| Gold V.1.3.1 signal Telegram Channel (English) |
GBPUSD: Pound Edges Lower Amid Geopolitical Tensions – Key Technical Patterns to Watch, July 17, 2026
2026-07-17 @ 13:01
Over the past 24 to 48 hours, the GBP/USD pair has experienced a softening trend, dropping slightly from yesterday’s closing price around 1.3477 to approximately 1.3459. The market was mainly influenced by the U.S.’s new wave of strikes against Iran, heightening geopolitical tensions which pressured the British Pound. This led to reduced risk appetite among investors and strengthened the U.S. dollar as a safe-haven asset. Despite the UK’s modest economic growth, the Pound lacked support, while the U.S. Dollar gained ground in response to retail sales data coming in line with expectations for June.
This surge in geopolitical uncertainty coupled with positive U.S. economic data pushed GBP/USD below the key psychological level of 1.3500 during Asian trading hours. For the average investor, this indicates that amid global uncertainties, the U.S. dollar’s role as a safe asset is reinforced whereas the Pound faces external political pressure weakening its value. Going forward, investor attention remains on the Bank of England’s potential rate hike decisions and upcoming UK leadership changes, both of which could further influence GBP/USD volatility and require cautious trading strategies.
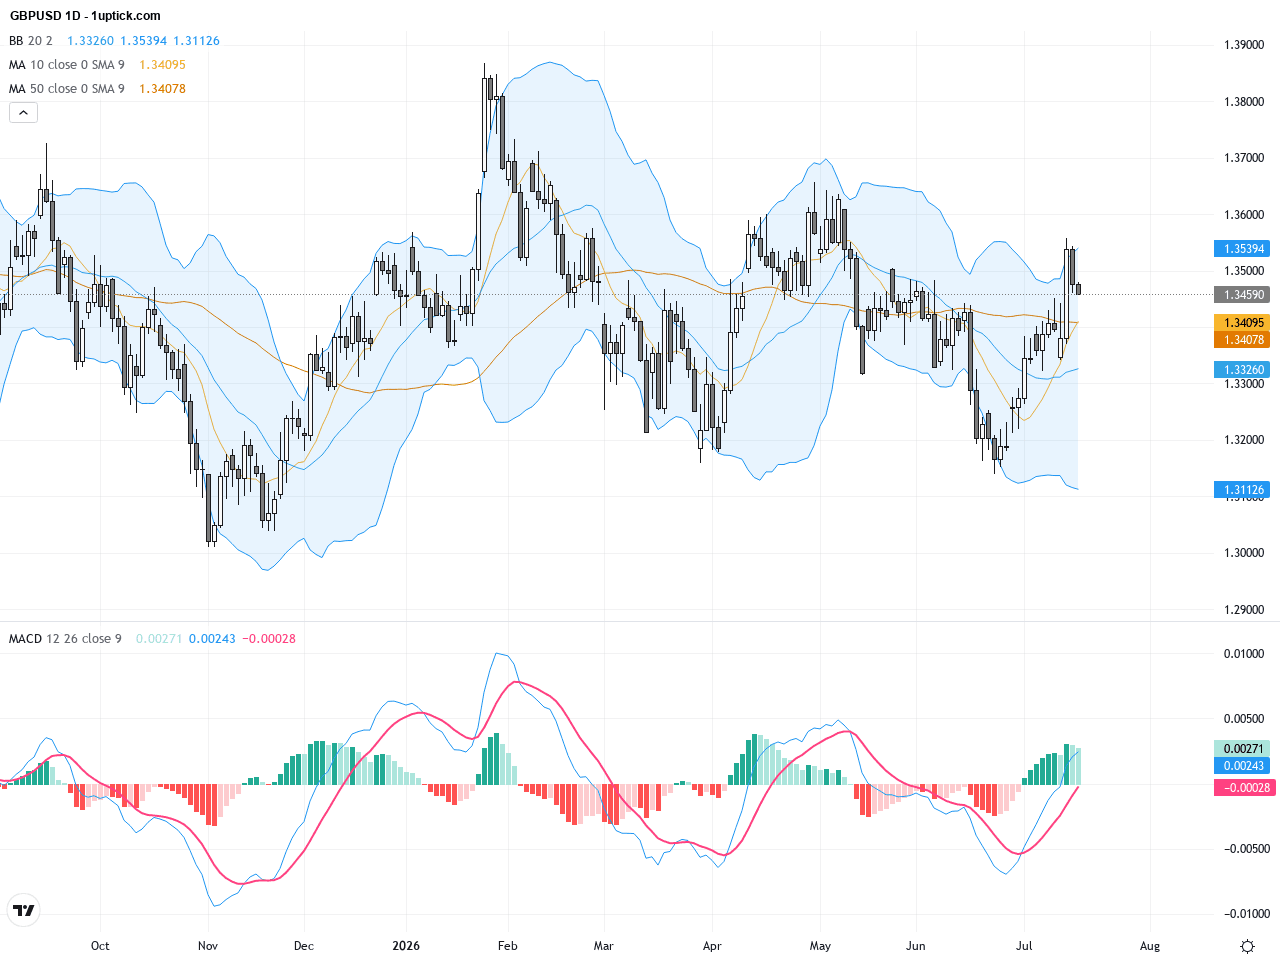
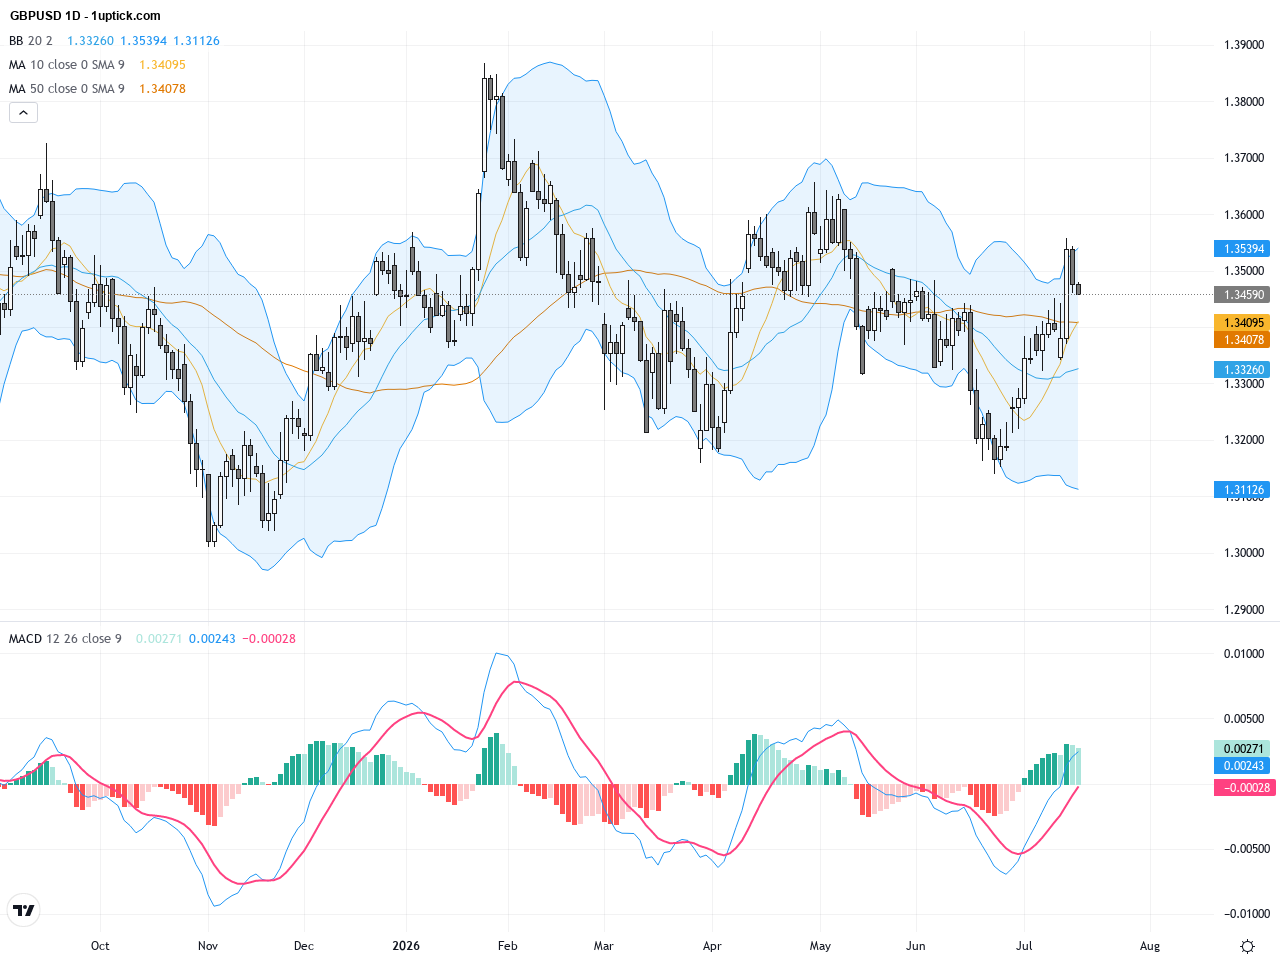
The daily chart reveals GBPUSD trading within a mild downward trend, fluctuating between 1.34 and 1.36. The 50- and 200-day moving averages, located near 1.3360 and 1.3426 respectively, act as resistance barriers. Bollinger Bands show moderate width with price near the middle band, and MACD is negative signaling seller dominance. A triangle consolidation pattern is forming, indicating an imminent breakout. A decisive break below 1.34 could trigger further losses.
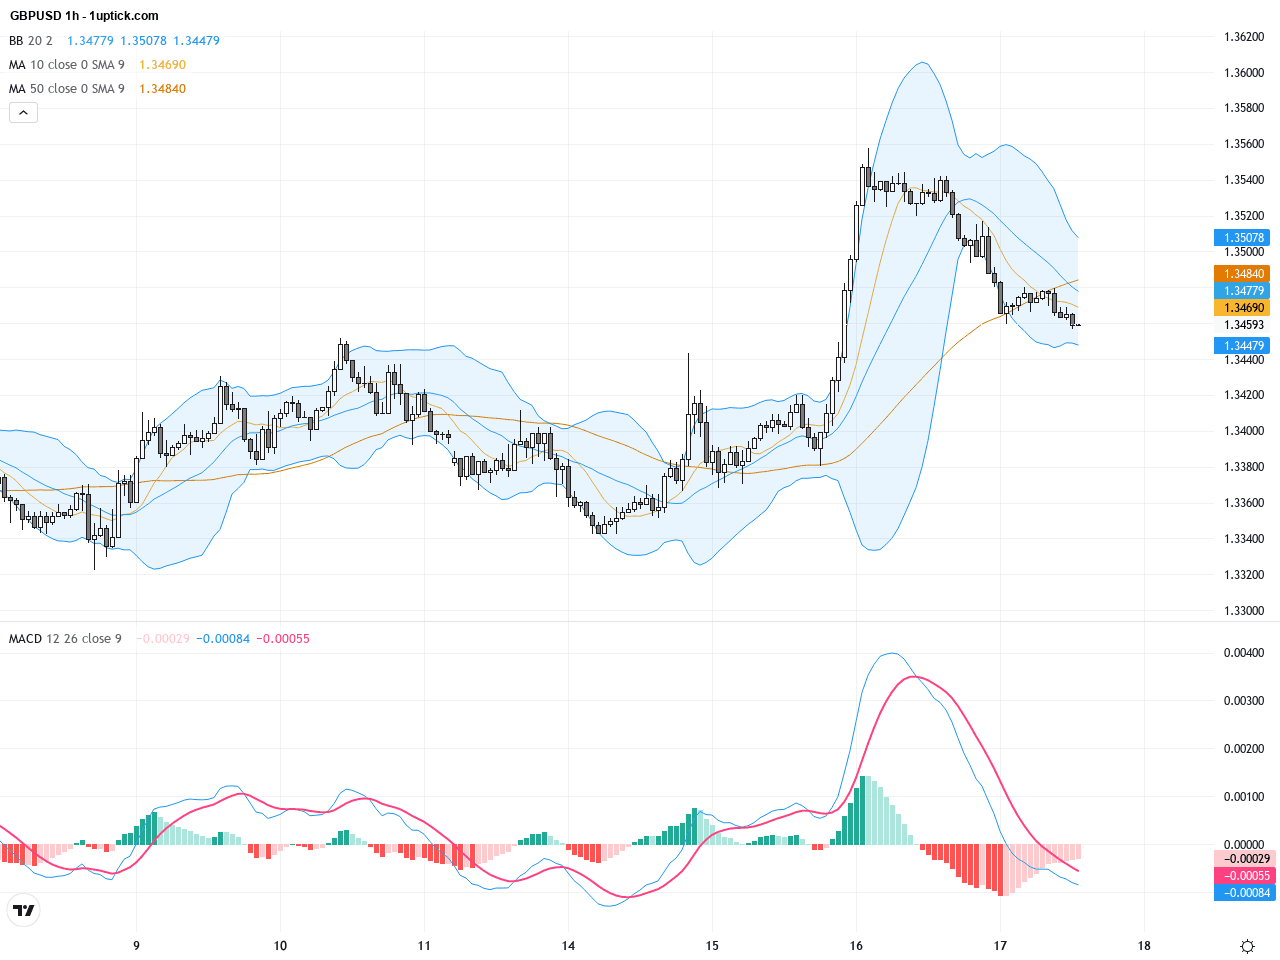
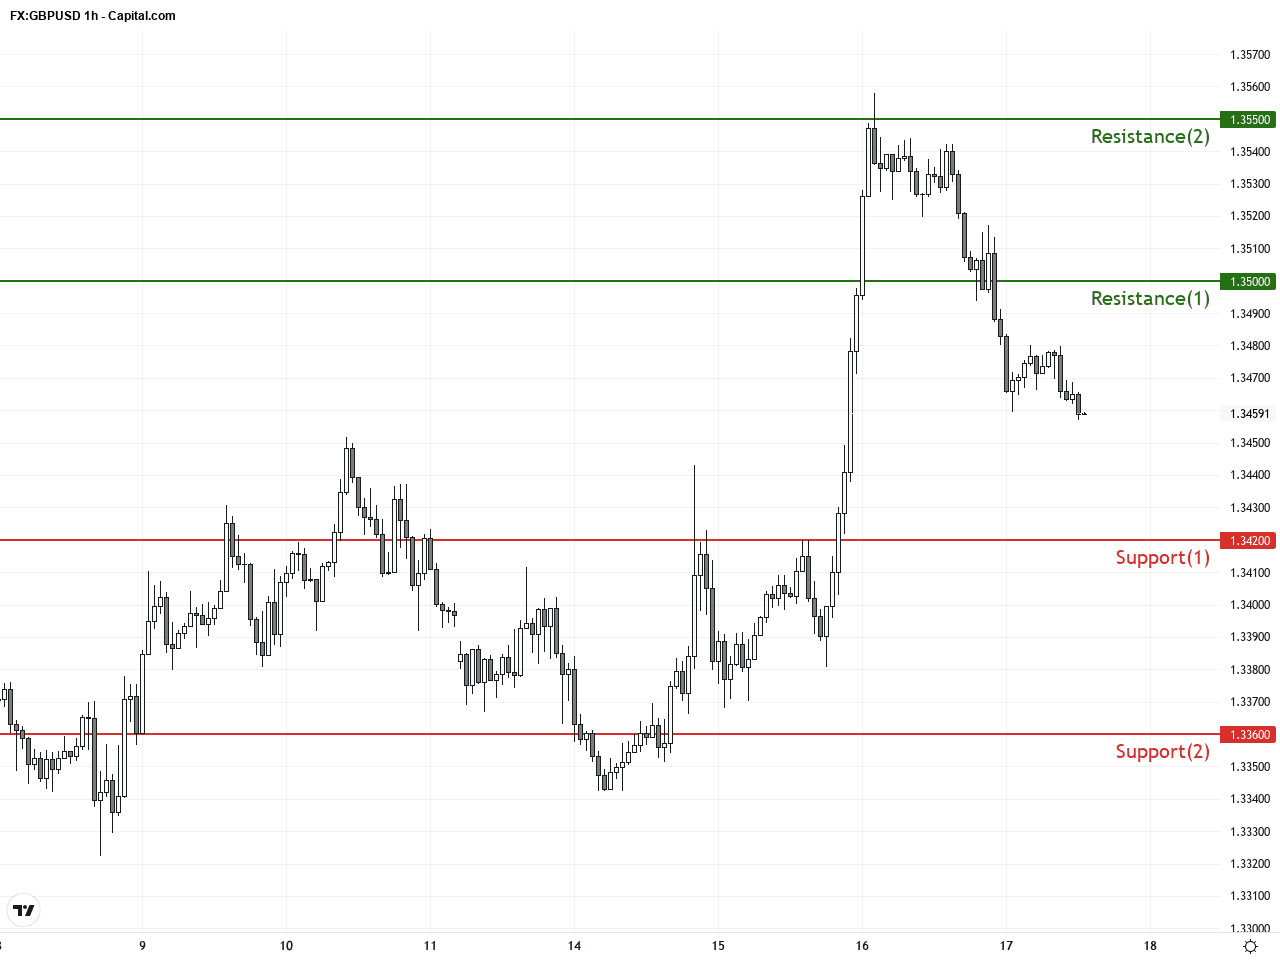
Short-term hourly charts show GBPUSD hovering around 1.3470 with a descending flag pattern widely visible. Price oscillates between 20 and 50-period moving averages. The MACD remains below zero but momentum is fading, and the narrowing Bollinger Bands point to decreased volatility. Recently, a bearish engulfing candlestick formed, signaling increasing selling pressure over the next 24 hours likely towards the 1.3420 support level.
Technical Trend: Cautiously Bearish with mild downward consolidation in the short term.
Technically, GBPUSD shows cautious bearish bias with mixed signals from technical indicators. The daily triangle pattern points to an impending breakout, with downside risk prevailing. The hourly bearish engulfing candle and negative MACD reinforce short-term selling pressure. Holding above 1.35 remains important to arrest declines and re-ignite buyers. Watch for volume spikes accompanying any breakout as that will present a high-probability trade setup.Today’s GMT+1 economic calendar highlights several important US releases including Export and Import Prices, Building Permits, Housing Starts, Industrial Production, Capacity Utilization, and the University of Michigan Consumer Sentiment Index. These data points are key for the US Dollar and thus GBPUSD. Stronger-than-expected US data will likely lift the USD and weigh on GBPUSD, while softer data could provide relief to the Pound. No direct UK data is scheduled today, focusing attention on US figures.
Resistance & Support
The above financial market data, quotes, charts, statistics, exchange rates, news, research, analysis, buy or sell ratings, financial education, and other information are for reference only. Before making any trades based on this information, you should consult independent professional advice to verify pricing data or obtain more detailed market information. 1uptick.com should not be regarded as soliciting any subscriber or visitor to execute any trade. You are solely responsible for all of your own trading decisions.