



 |
| Gold V.1.3.1 signal Telegram Channel (English) |
USDJPY Consolidates Below Key Resistance: Watch for Breakout Amid Yen Dynamics, July 17, 2026
2026-07-17 @ 11:01
Over the past 24 to 48 hours, the USD/JPY pair has been trading within a tight range around 162.36, showing only slight movement from yesterday’s closing price of 162.367. Amid escalating geopolitical tensions in the Middle East and softer-than-expected US June CPI data, the market demonstrated noticeable caution.
With weaker US consumer inflation, expectations for aggressive Federal Reserve rate hikes have eased, leading to a weaker dollar index and applying downward pressure on USD/JPY, briefly testing the lower end of the range. Nevertheless, the yen failed to show strong gains due to ongoing ultra-loose Bank of Japan policies and concerns over potential BoJ intervention, maintaining the pair’s sideways trend.
Furthermore, a top forex forecaster predicts the dollar-yen could reach the 170 level by 2027, a significant signal for long-term investors and crypto market participants alike. Overall, USD/JPY’s recent price action reflects investors’ cautious stance amid the interplay of global uncertainties and macroeconomic updates over the last two days.
Put simply for everyday investors, recent USD/JPY price moves have been primarily driven by disappointing US CPI figures and the market’s reassessment of Fed policy direction, while a weak yen coupled with potential Bank of Japan market intervention risks have capped downside, resulting in a consolidative trading pattern.
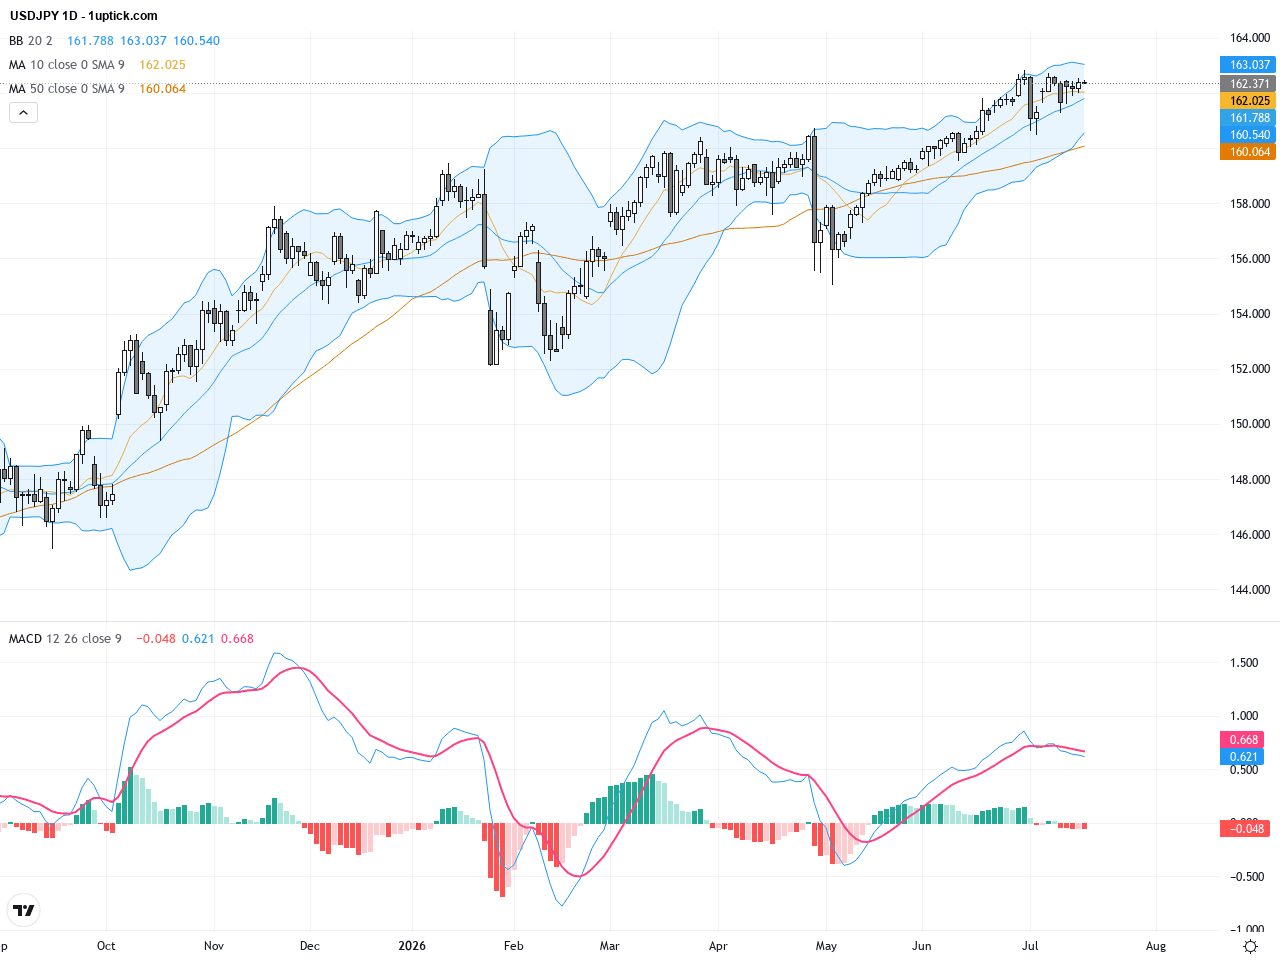
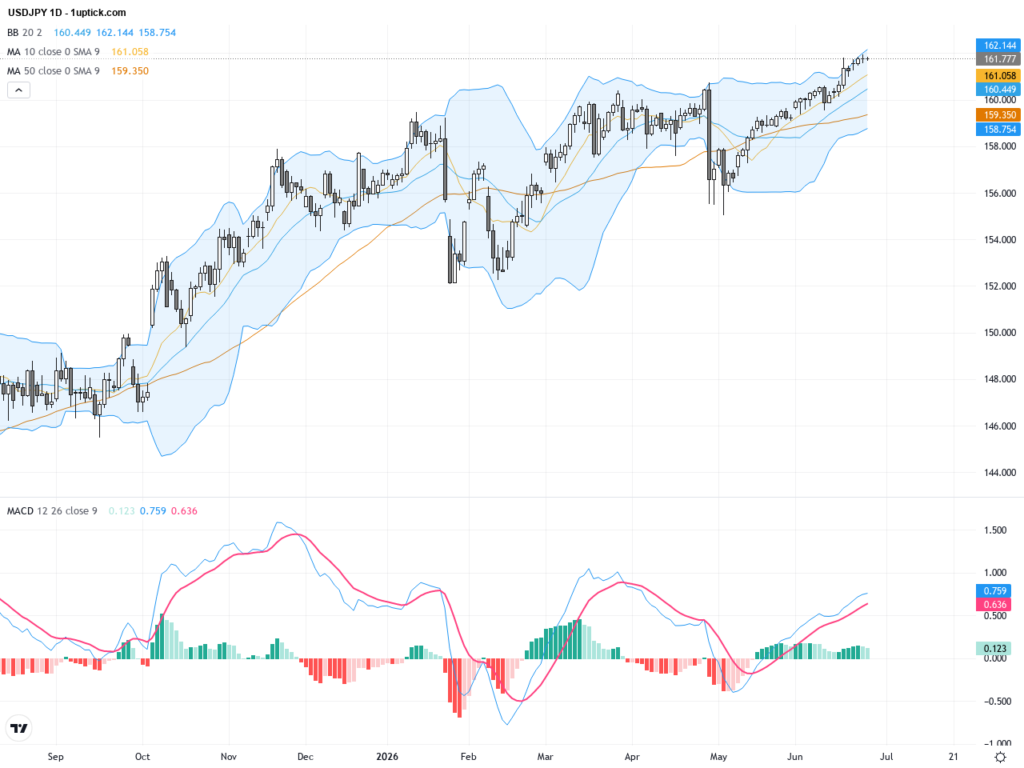
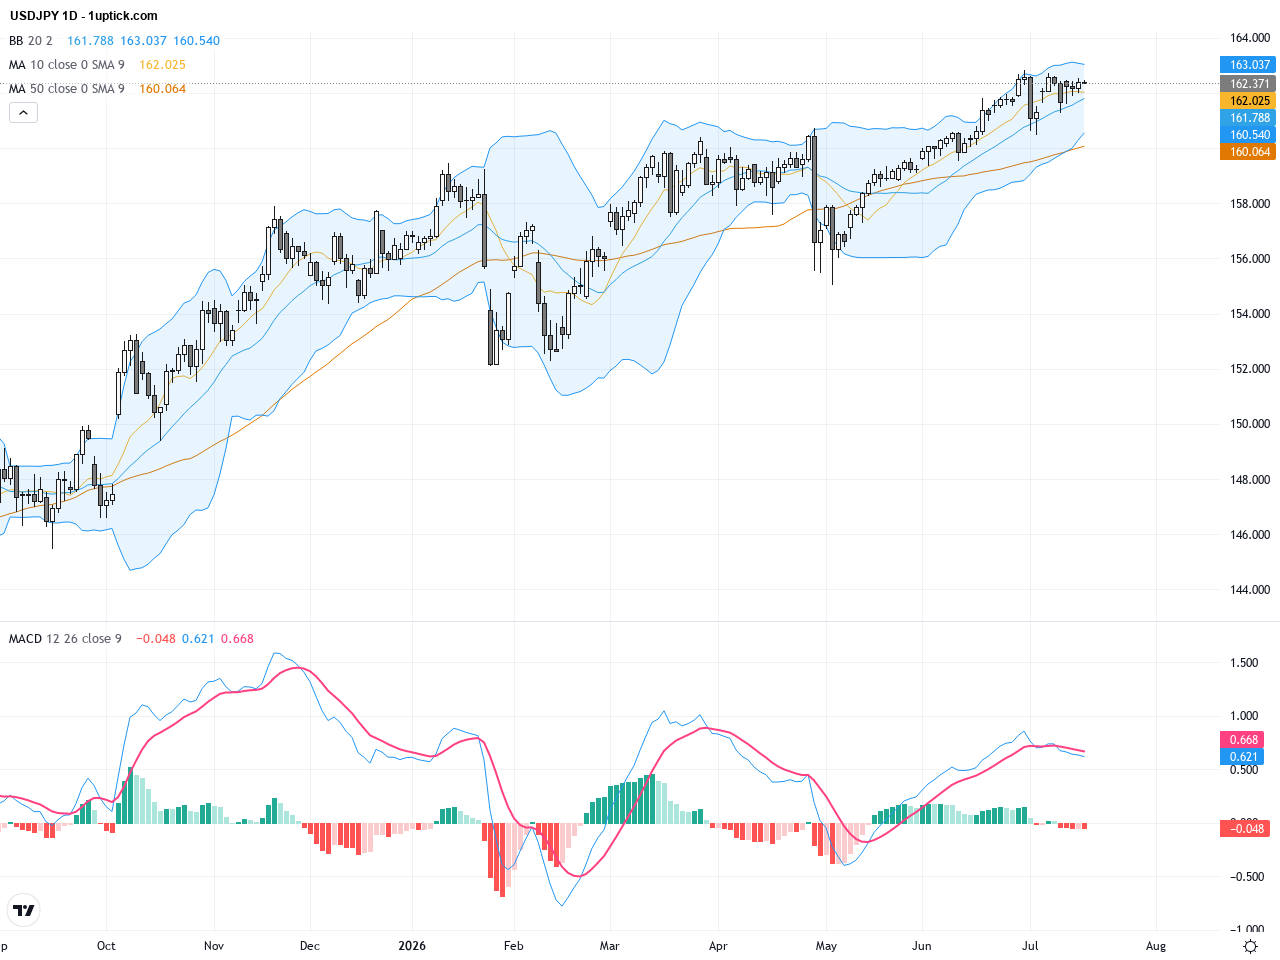
The daily chart shows USDJPY retreating slightly from recent highs near 162.83 but remaining above both the 50-day moving average (~160.32) and 200-day moving average (~157.28), indicating sustained medium to long-term bullish structure. Bollinger Bands are narrowing, suggesting the range-bound market is nearing a breakout phase. The MACD histogram is contracting but has yet to produce a bearish crossover, implying potential for a directional move near key resistance levels.
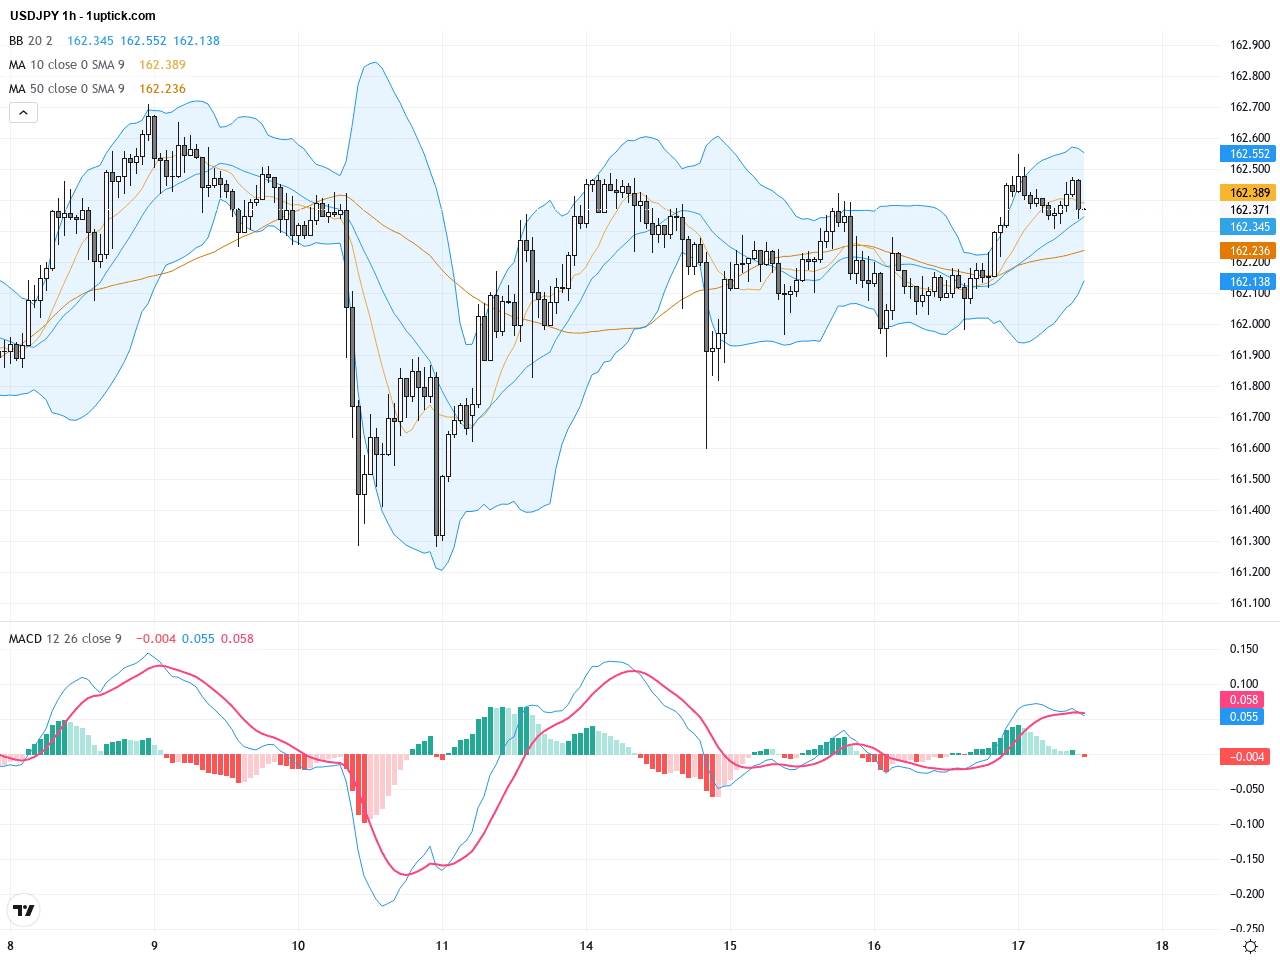
On the hourly chart, USDJPY is consolidating within a tight range of 162.30 to 162.50 with declining volume. The 20-period moving average lies beneath the price, providing support. MACD lines are approaching a crossover near the zero axis, signaling a possible momentum shift. Recent hammer candlesticks with long lower shadows point to buying pressure and short-term bounce potential, though confirmation through increased volume is necessary.
Technical Trend: The overall trend is ‘cautiously consolidating,’ awaiting clear breakout confirmation for next direction.
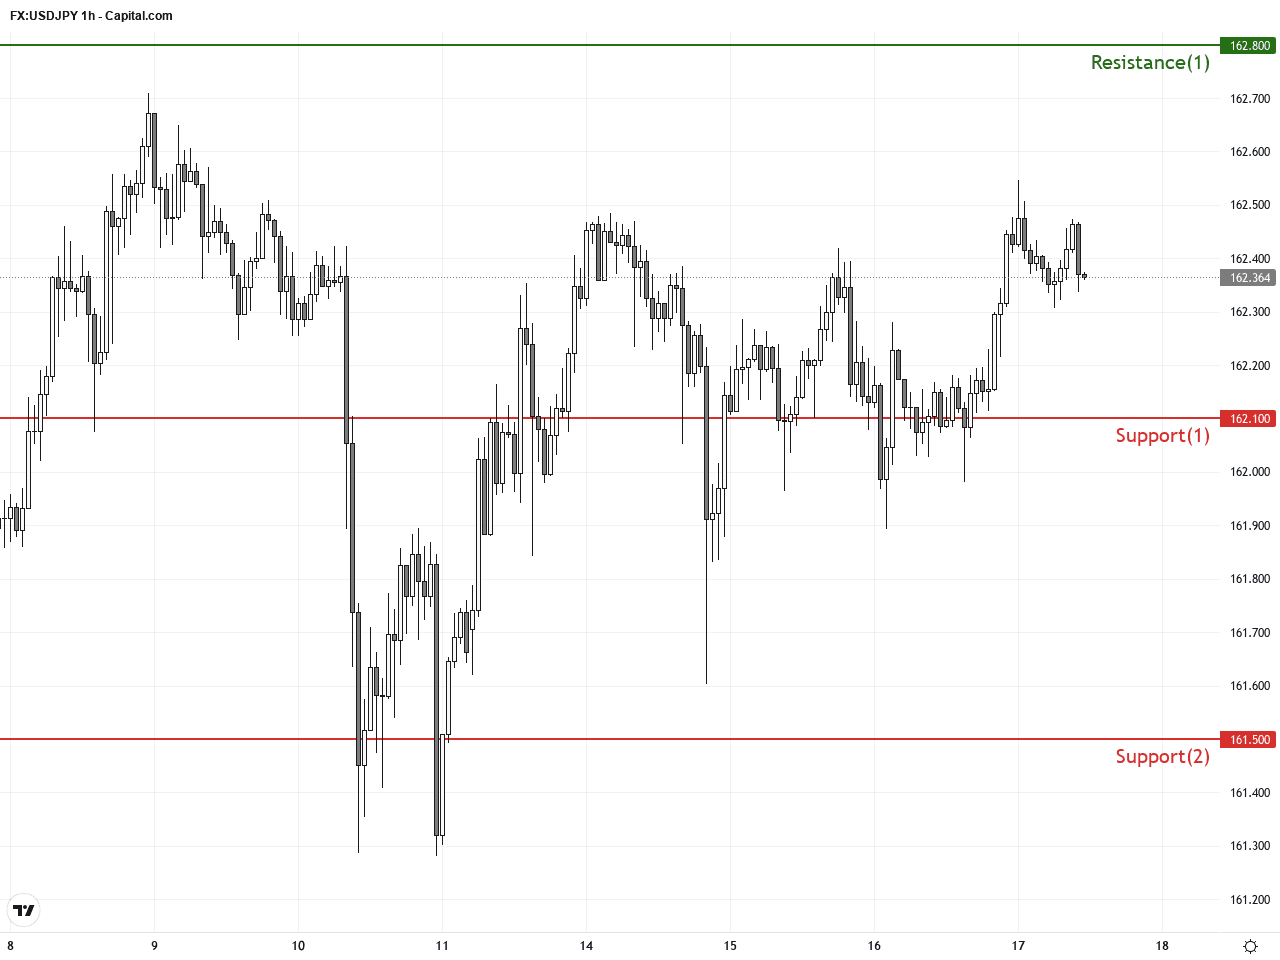
Technically, USDJPY remains at a critical battleground with MACD nearing a bullish crossover. Rising volume alongside this would confirm continued upside momentum. The presence of hammer candlesticks and Bollinger Bands tightening imply a potential end to consolidation. Key horizontal levels to watch are resistance at 162.80 and support at 162.10; breaks will likely offer actionable trade signals.No significant economic data directly impacting USD or JPY is scheduled today. The EU will release various CPI and current account figures which should have limited direct effect on USDJPY. However, upcoming US data in the evening including building permits, industrial production, and consumer sentiment indices may influence USD strength; better-than-expected outcomes could boost USDJPY, whereas weaker data may extend the current consolidation.
Resistance & Support
The above financial market data, quotes, charts, statistics, exchange rates, news, research, analysis, buy or sell ratings, financial education, and other information are for reference only. Before making any trades based on this information, you should consult independent professional advice to verify pricing data or obtain more detailed market information. 1uptick.com should not be regarded as soliciting any subscriber or visitor to execute any trade. You are solely responsible for all of your own trading decisions.