

 |
| Gold V.1.3.1 signal Telegram Channel (English) |
XAUUSD: Critical Resistance at 4220 Highlights Gold’s Trading Outlook Amid Mixed Market News, July 17, 2026
2026-07-17 @ 05:04
Over the past 48 hours, gold spot prices (XAUUSD) have experienced notable volatility. Starting from a closing price near $3975/oz on July 16, 2026, gold surged following softer-than-expected US inflation data, breaching the $4100 mark at one point. However, rising oil prices and a hawkish stance from the Federal Reserve capped further gains. Market sentiment was lifted by the Producer Price Index (PPI) easing, enhancing demand for gold as a hedge, yet climbing oil prices added inflationary concerns while the USD remained under pressure, creating divergent forces in the gold market.
On the news front, industry experts indicate that gold faces significant resistance around $4220, signaling cautious buying sentiment about sustained upside. According to Bank of America, gold is currently the most undervalued since March 2023, attracting an inflow of safe-haven funds. Nonetheless, some analysts maintain a bearish view, suggesting that without a fresh impulsive rally, the upside for gold remains limited.
For the average investor, the recent softening of US inflation is akin to a brief breathing space for gold, offering a short-term lift. Yet geopolitical tensions in the Middle East and evolving oil price dynamics remain key uncertainties. In simpler terms, gold is walking a tightrope: guided by inflation relief but hampered by oil price pressures and Fed policy directions, calling for cautious monitoring moving forward.
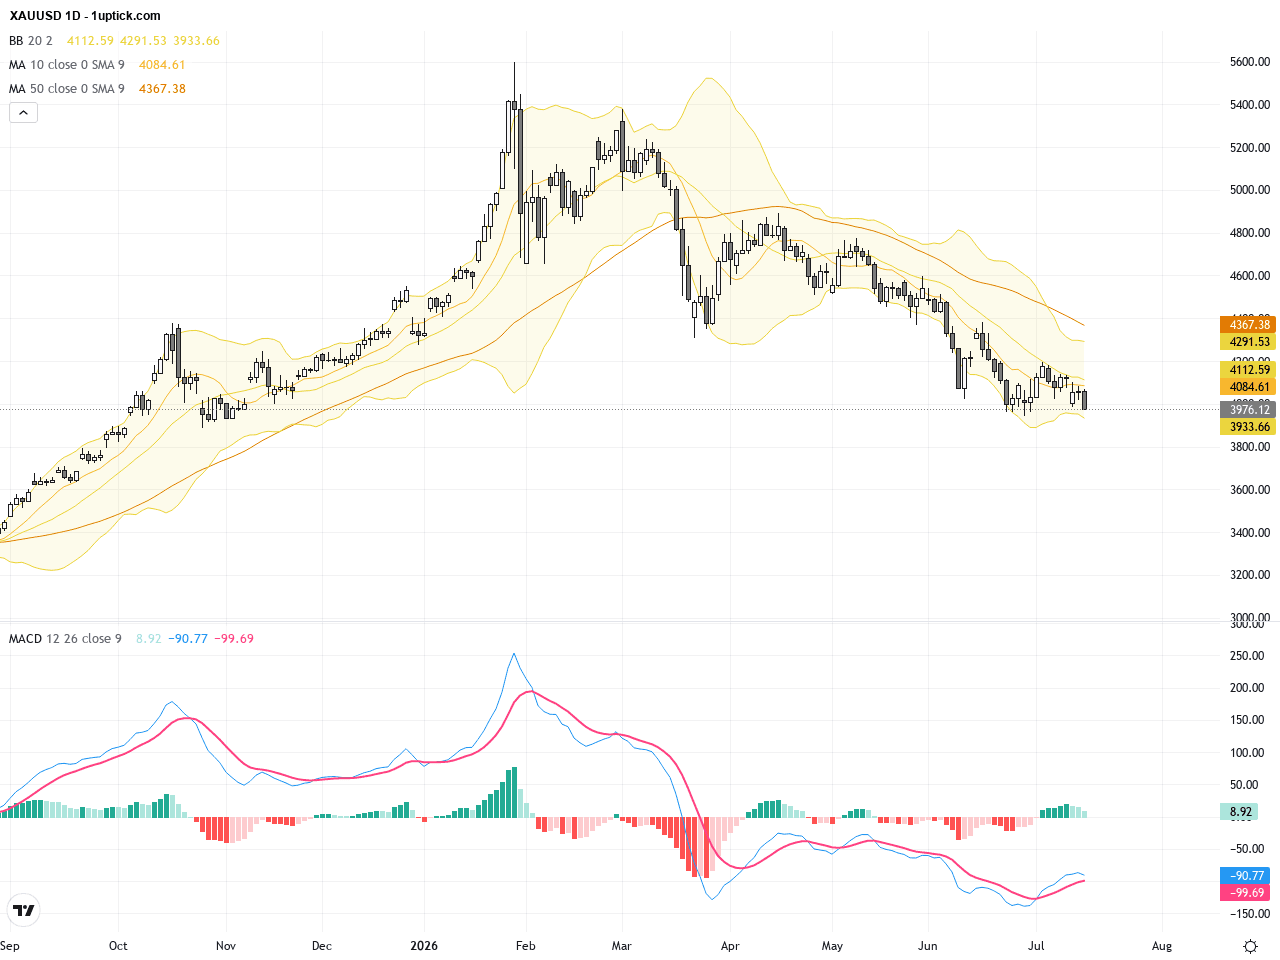
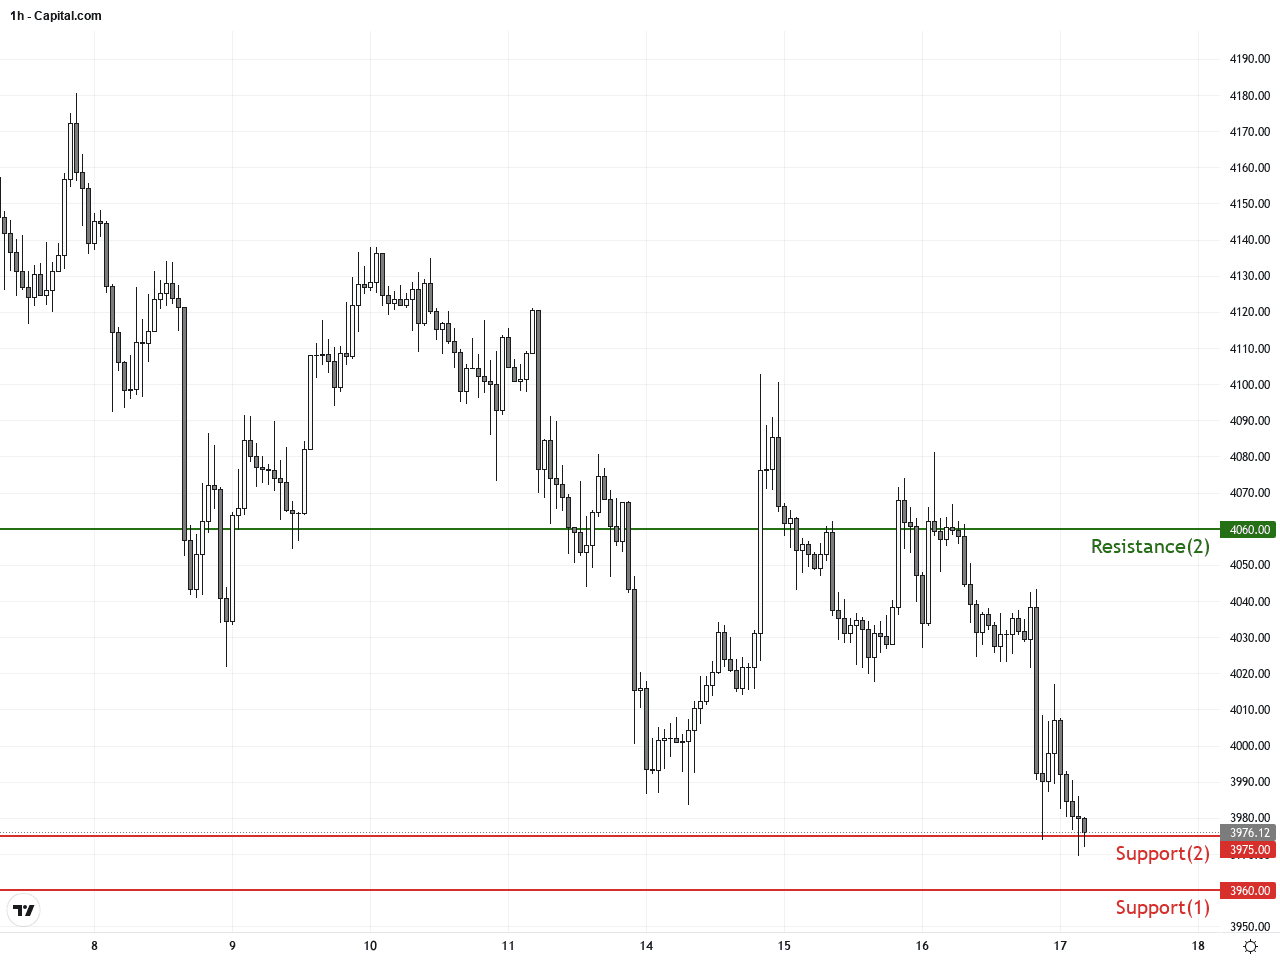
The daily chart for XAUUSD reveals a downward pressure since early July, with prices oscillating around the 4000 level. Moving averages such as the 20- and 50-day MAs slope downward, indicating a longer-term bearish trend. Bollinger Bands have narrowed, showing consolidation, but recent price action tests the middle band suggesting an attempted recovery. MACD histogram shows positive divergence signs, implying a potential rally if the 4220 resistance is breached. Key levels are support near 3960 and resistance at 4060 and 4220, reinforcing the bears’ control.
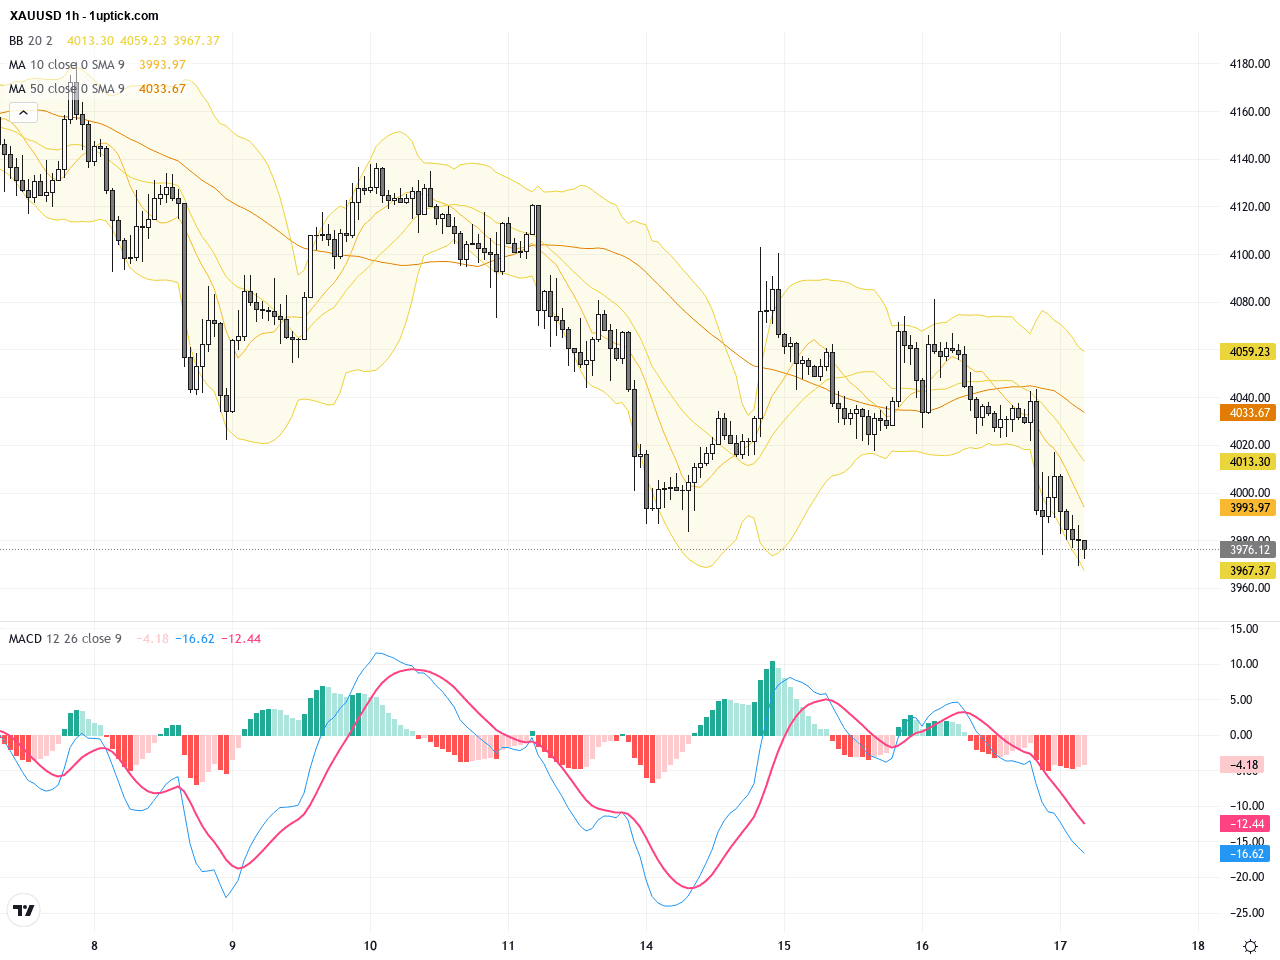
The hourly chart captures intense price swings over the last 3-5 days, with XAUUSD plunging to near 3970 before bouncing back as the U.S. dollar softened. Short-term moving averages (9 and 21 periods) are converging, hinting at an imminent momentum shift. The Bollinger Bands midline acts as a resistance zone. MACD lines are close to crossing, suggesting possible short-term uplift or continued sideways range. A significant inverted hammer candlestick recently formed at the rebound peak, signaling caution for bulls seeking further gains.
Technical Trend: XAUUSD is currently in a cautious sideways consolidation with a bearish bias, struggling to break the critical resistance at 4220, reflecting a tentative and pressured market environment.
Technically, the daily MACD has started showing bullish divergence indicating a possible bottoming and short-term rebound. However, the key resistance zone at 4220 needs to be overcome to confirm a sustained recovery. The hourly chart patterns such as the inverted hammer candlestick and narrowing trading bands point to a fragile and conflicted momentum environment. Monitoring volume spikes and breakout above the moving average lines will be critical to spot high-confidence trading entries in the near term.Today’s economic calendar in GMT+1 shows a slate of UK data at 08:00 including GDP, trade balance, and industrial indicators. These print generally steady results with limited surprises, having minimal direct influence on XAUUSD. The focus should be on US data at 14:30, especially Retail Sales and the Philadelphia Fed Manufacturing Index. Strong US data would likely strengthen the dollar and pressure gold prices, while weaker numbers could provide relief for gold bulls. Overall, no major immediate or direct event is expected today to cause sharp moves in XAUUSD; technical patterns remain the primary guidance.
Resistance & Support
The above financial market data, quotes, charts, statistics, exchange rates, news, research, analysis, buy or sell ratings, financial education, and other information are for reference only. Before making any trades based on this information, you should consult independent professional advice to verify pricing data or obtain more detailed market information. 1uptick.com should not be regarded as soliciting any subscriber or visitor to execute any trade. You are solely responsible for all of your own trading decisions.