








 |
| Gold V.1.3.1 signal Telegram Channel (English) |
AUDUSD: Key Support at 0.7090 Holds as Fed Hike Odds Fade, Trading Outlook Turns Cautiously Bullish, July 20, 2026
2026-07-20 @ 06:01
Over the past 48 hours, the AUD/USD exchange rate showed notable resilience, primarily influenced by softer-than-expected US inflation data, which led the market to drastically reduce its odds of a Federal Reserve rate hike in July to around 10%. The pair closed yesterday at 0.69652, slightly down from 0.69984 the previous day but maintaining a relatively stable range overall.
The market movement was driven by recent US data showing easing wage and inflation pressures, diminishing fears of aggressive tightening by the Fed. Moderate comments from Fed officials helped soothe hawkish expectations. For the average investor, this scenario can be seen as a brief slowdown in US economic momentum, enabling the Australian dollar to gain support amid improved risk appetite and thus hold a relatively stronger tone.
Moreover, the AUD’s characteristics as a high-beta risk asset became more apparent, with its correlation to global equities surging to 0.95, highlighting how risk sentiment directly impacts its price action. Although short-term pullbacks cannot be ruled out, the AUD/USD pair continues to demonstrate upside momentum amid shifting US policy expectations and a recovering global risk environment.
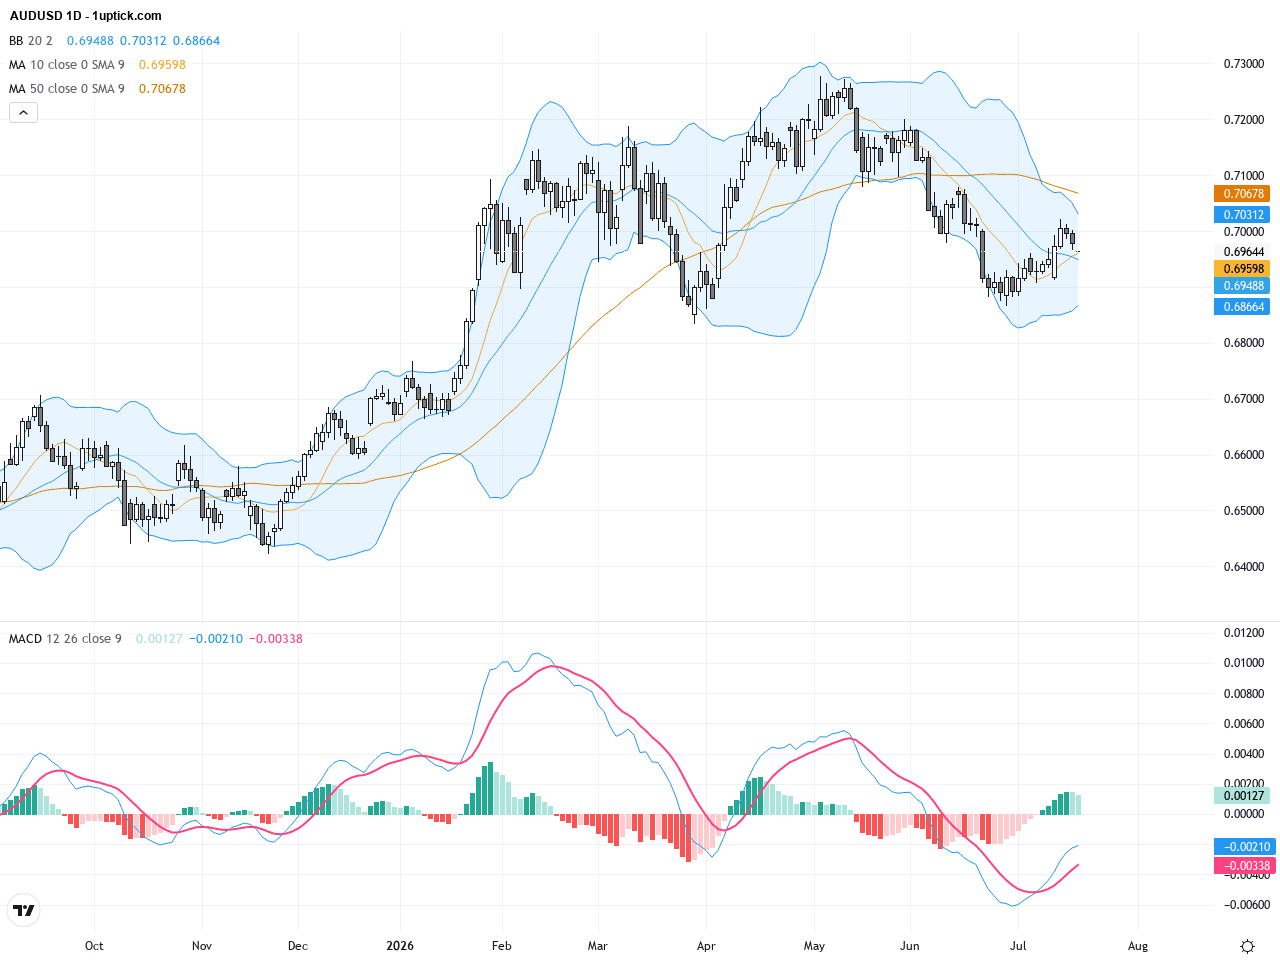
The daily chart depicts AUDUSD trading above its 200-day moving average at 0.68742 since the start of the year, but remaining below the 50-day average of 0.70508. Last week, the price retreated from the psychological 0.7000 level to close yesterday near 0.69652, indicating resistance to further gains. Bollinger Bands have narrowed, signaling subdued volatility, while the MACD hovers near the zero line, reflecting a lack of strong directional momentum. The price has formed a shallow rebound near the 0.7090 support, suggesting equilibrium between buyers and sellers and signaling potential sideways movement in the near term.
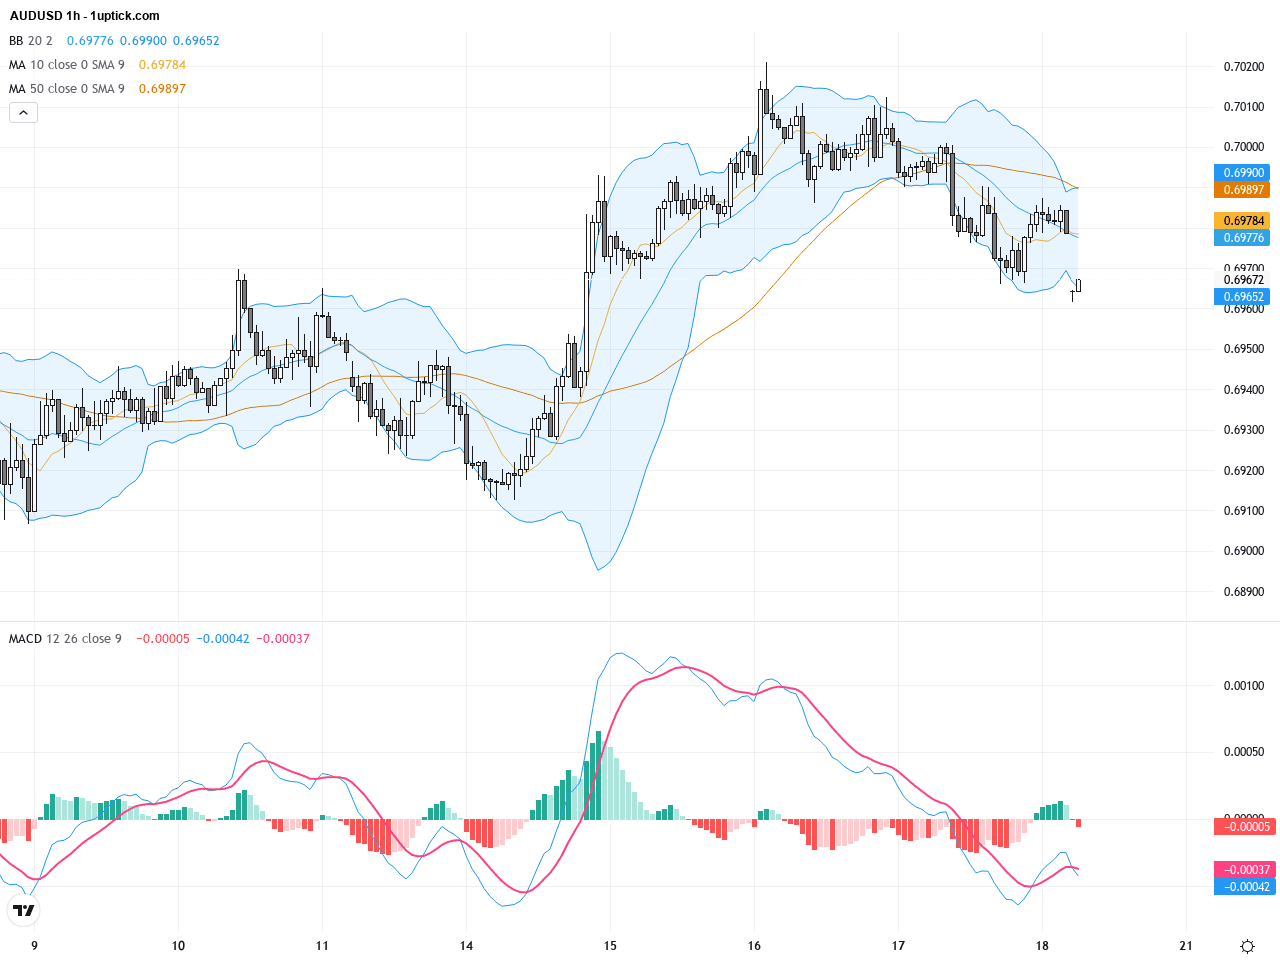
On the hourly chart, AUDUSD has trended upwards over the past 3-5 days, breaking out from the 0.6910 area. Short-term moving averages (like the 5 and 20 periods) are converging higher with prices trading above the middle Bollinger Band, indicating short-term bullish bias. However, weakening MACD histogram momentum and an RSI approaching overbought territory suggest a slowdown in buying pressure, raising the possibility of short-term consolidation or pullback. Overall, the short-term technical setup calls for cautious monitoring of critical support and resistance levels.
Technical Trend: The current trend direction is cautiously bullish, driven by risk appetite shifts and dollar weakness but tempered by short-term technical pressure and fading momentum. Traders are advised to maintain disciplined, measured entries to navigate the expected volatility.
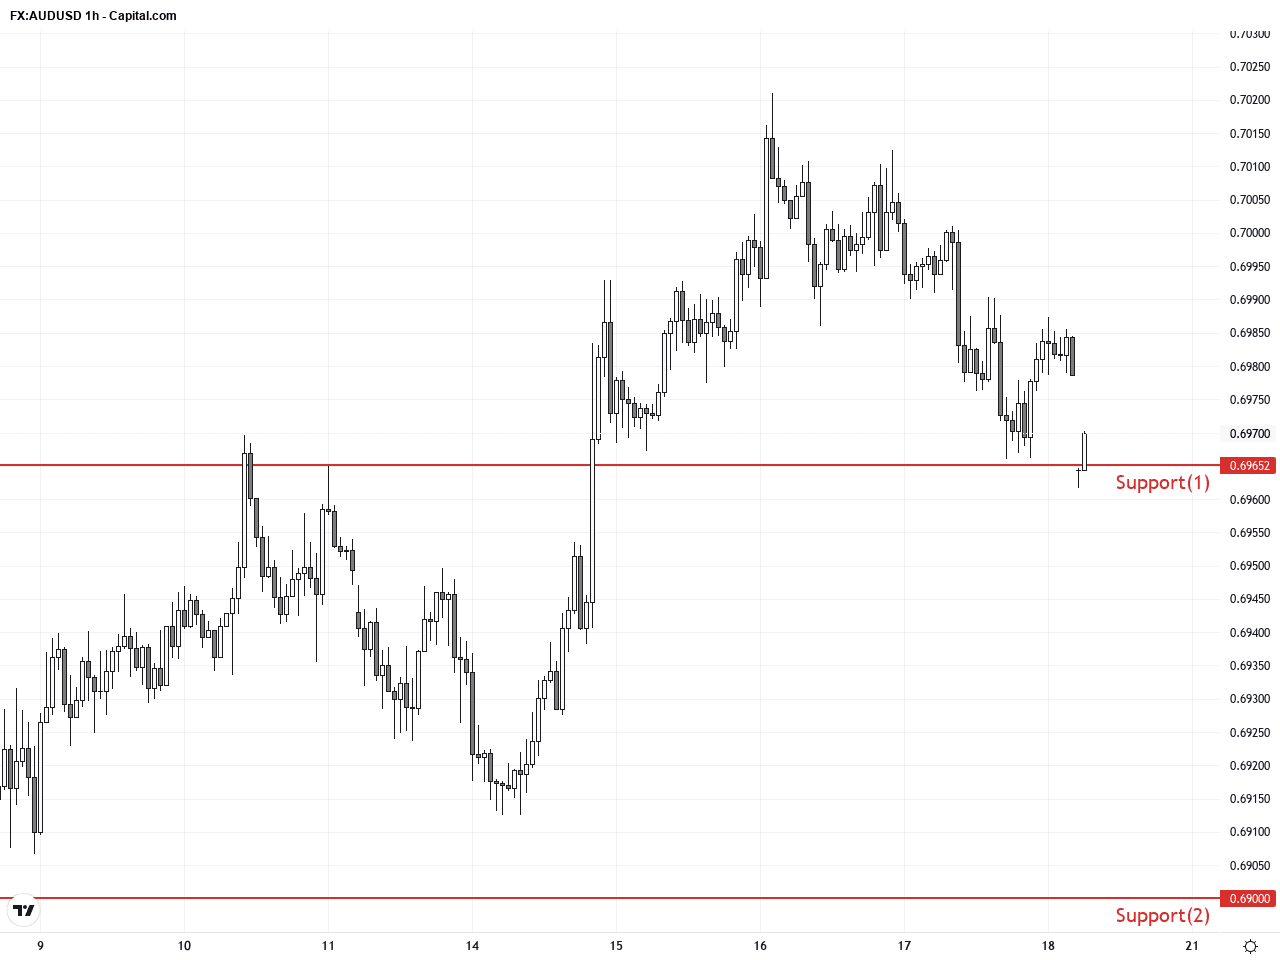
From a technical perspective, AUDUSD is forming a corrective multi-day bullish wave on the daily chart with key support at 0.7090 sustaining the rebound sequence. Meanwhile, recent upper wick candlesticks and elevated RSI readings hint at potential technical fatigue. MACD is approaching a bullish crossover, indicating a short-term reversal chance if the pair can break above the 50-day MA at 0.7050. Failure here could lead to a re-test of supports around 0.6960 and 0.6900, marking potential areas for tactical buying.Today’s economic calendar in GMT+1 zone does not feature any major events directly impacting AUDUSD. Key Australian and New Zealand data releases remain pending, keeping the focus on US macroeconomic indicators and Federal Reserve commentary. Traders should watch later data such as the US Conference Board Leading Indicators, whose results matching expectations might slightly influence the USD and, by extension, AUDUSD in the short term.
Resistance & Support
The above financial market data, quotes, charts, statistics, exchange rates, news, research, analysis, buy or sell ratings, financial education, and other information are for reference only. Before making any trades based on this information, you should consult independent professional advice to verify pricing data or obtain more detailed market information. 1uptick.com should not be regarded as soliciting any subscriber or visitor to execute any trade. You are solely responsible for all of your own trading decisions.