









 |
| Gold V.1.3.1 signal Telegram Channel (English) |
USDJPY: Steady Above 162 After Breaking Nine-Day EMA with Key Support and Resistance Insights, July 20, 2026
2026-07-20 @ 11:01
The USD/JPY currency pair exhibited continued volatility over the past 24 to 48 hours, closing yesterday near 162.363, a modest increase of 0.01 points from the previous day. While ongoing geopolitical tensions in the Middle East and rising oil prices have supported the US Dollar as a safe haven, recent reports of potential Japanese government intervention to stabilize the yen have added uncertainty, lending some strength back to the yen and capping the dollar’s advance.
Market analyses suggest that despite the near-term dollar strength, MUFG highlights a powerful long-term tailwind supporting the yen. Additionally, statements from Japan’s Finance Minister signaling possible intervention have kept investors cautious. Meanwhile, the US 10-year Treasury yield’s slight decline theoretically favors risk assets, impacting trader sentiment with USD/JPY fluctuating in response.
For the average investor, this currency turbulence means holding USD or JPY assets carries enhanced short-term risk. Those with investments tied to the yen-sensitive sectors or funds should monitor developments in Japanese financial policy and geopolitical events closely, as government intervention could trigger swift currency moves. Overall, the market remains focused on Middle East tensions and Japan’s policy actions as the key drivers steering USD/JPY volatility in the short term.
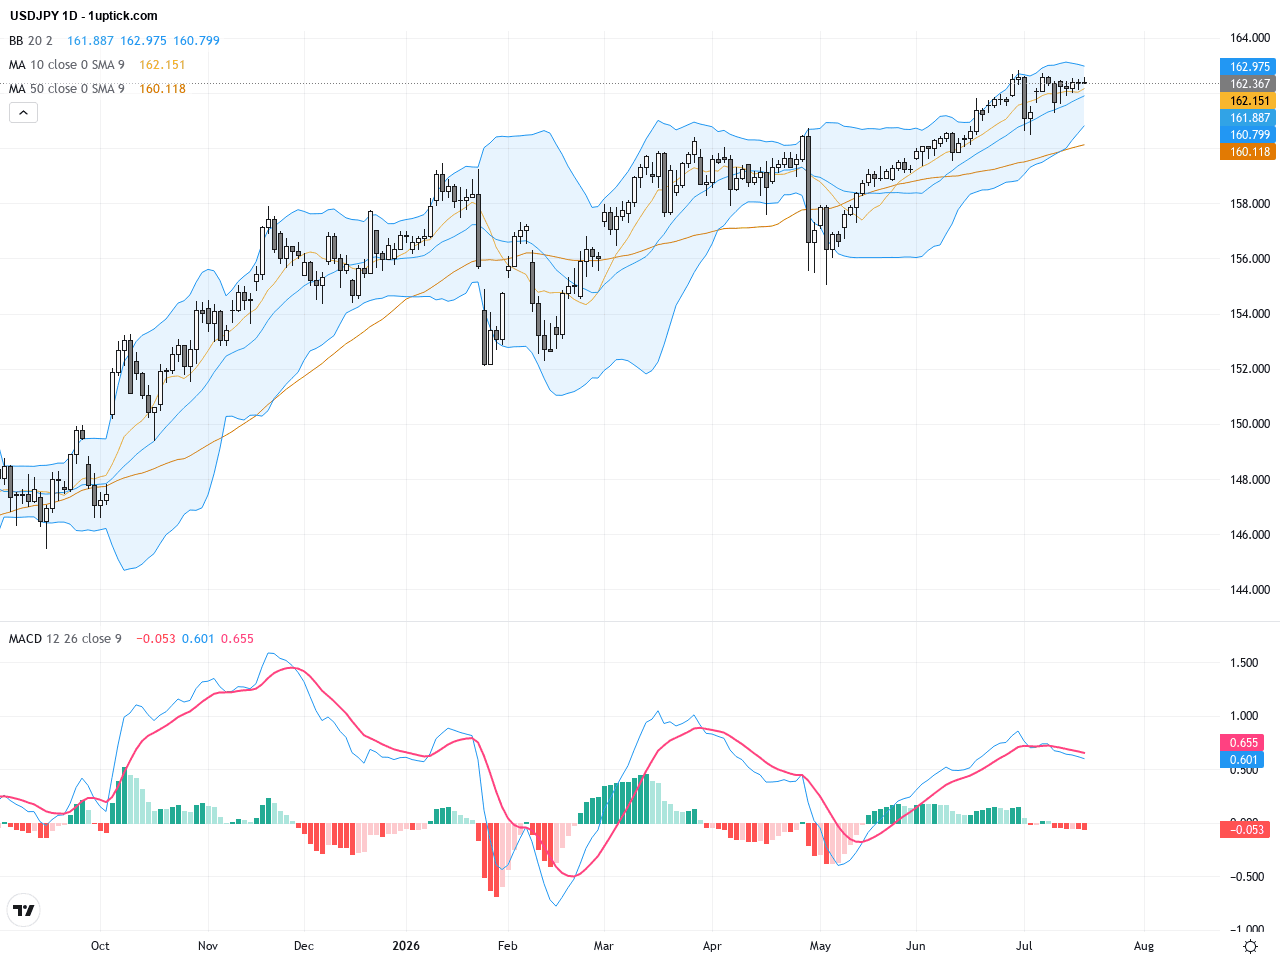
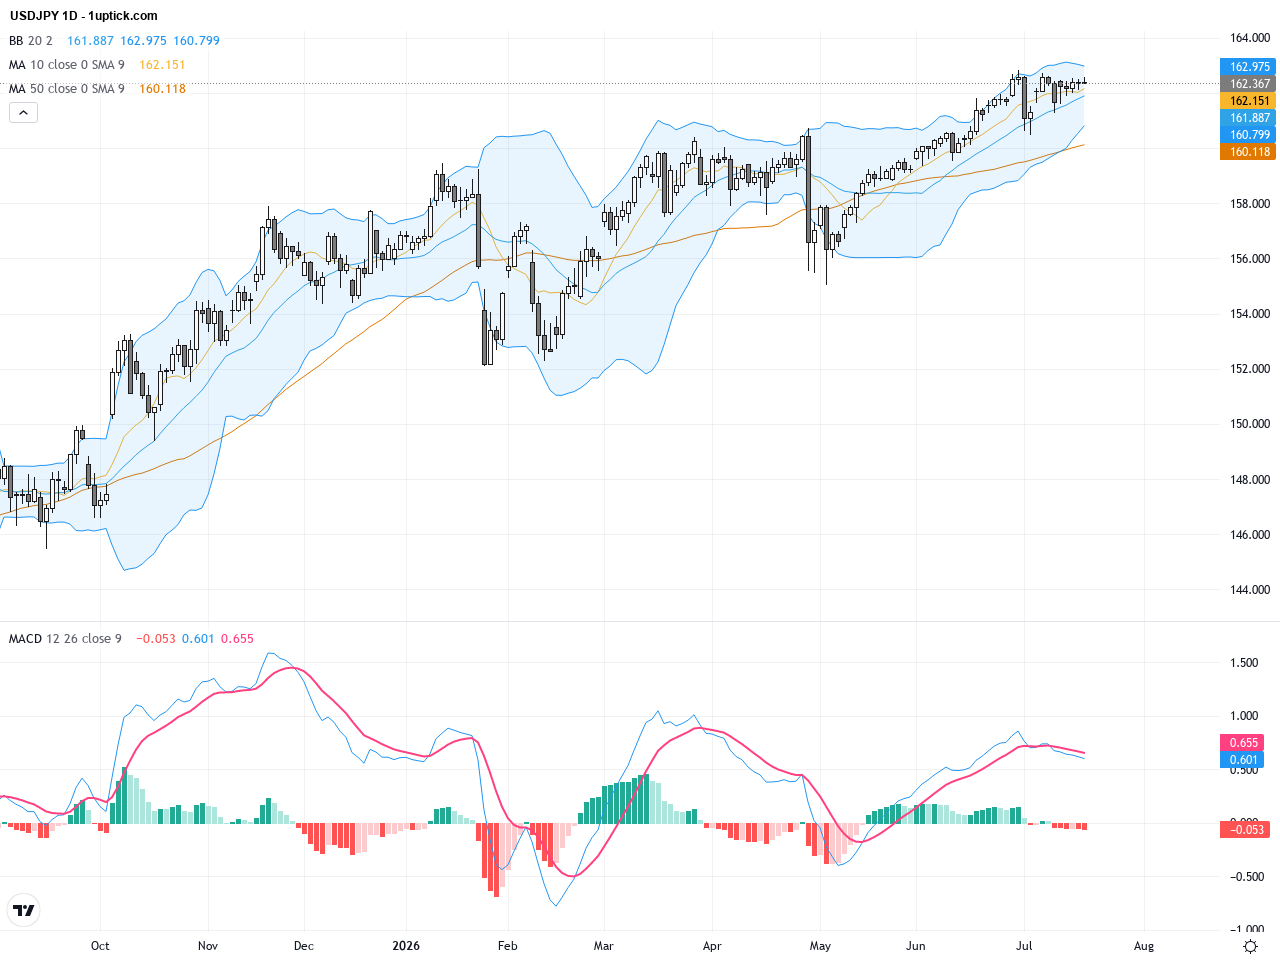
The daily chart shows a strong uptrend in USDJPY from the 145 low, with prices clearly above both the 50-day and 200-day moving averages, reinforcing a bullish structure. Bollinger Bands are widening upwards, although recent volatility has tapered slightly. Volume expansion confirms buying interest. The MACD remains above the zero line with a bullish crossover between its fast and slow lines, indicating continued long-term upside momentum.
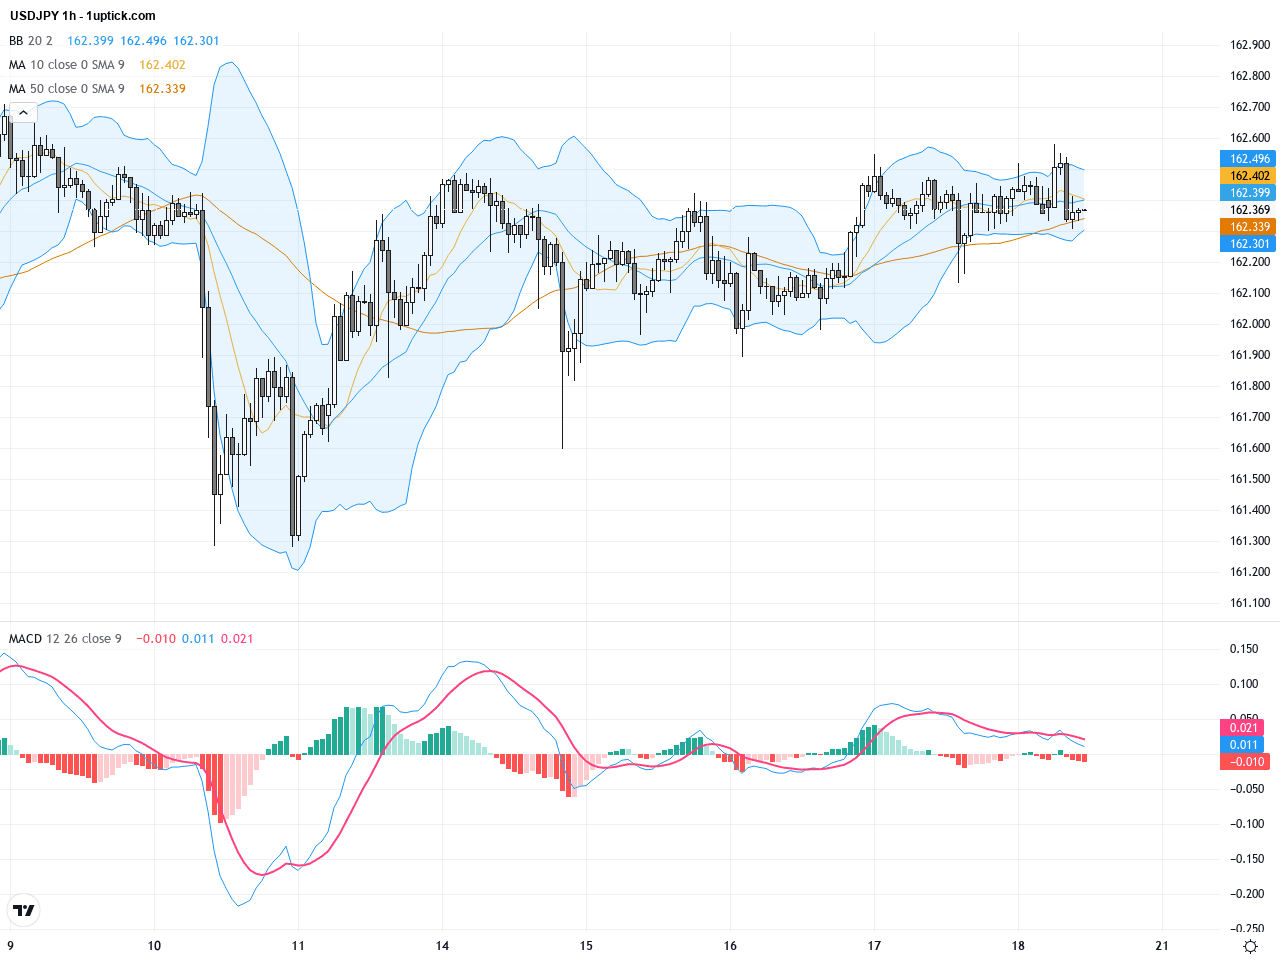
On the hourly timeframe, USDJPY has been consolidating between the nine-day EMA over the past 3 to 5 days. The MACD indicates strengthening momentum, while RSI hovers near the midpoint, suggesting balanced forces with upside potential. Recent bullish engulfing candlesticks point to underlying buying support. Short-term moving averages maintain a bullish alignment, supporting possible advances toward resistance levels.
Technical Trend: Steadily bullish
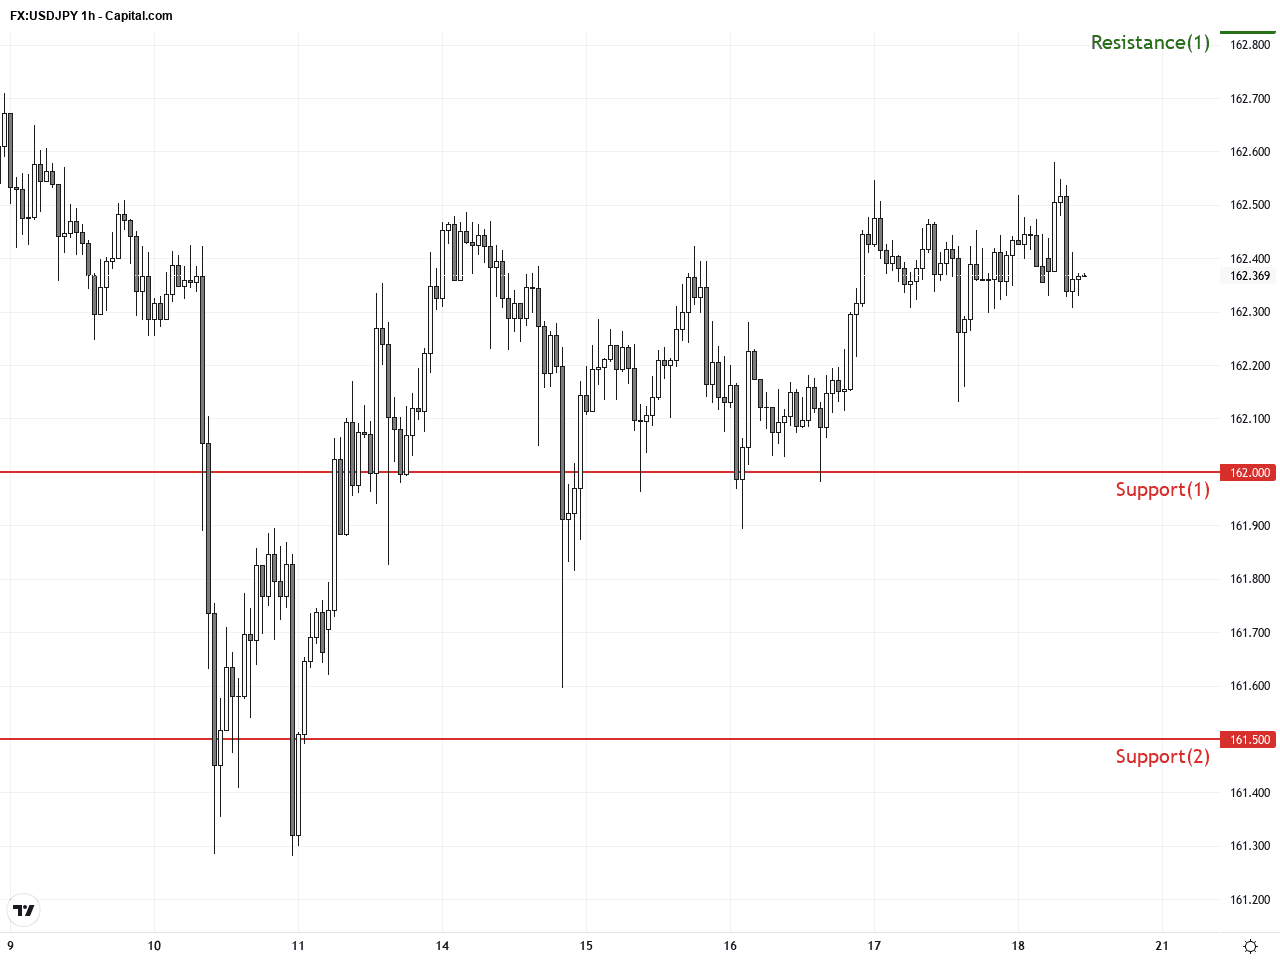
Technically, USDJPY’s break and hold above the nine-day EMA along with supportive volume profiles suggest sustained bullish momentum, although rallies have loosened slightly. MACD momentum is positive, signaling a probable retracement test near the 162 support. Bullish engulfing candlestick patterns indicate buyers have the upper hand in the next 24 hours. Maintaining the 162 level is crucial for challenging this year’s highs.Today’s GMT+1 economic calendar offers no significant or direct events impacting USDJPY. Key economic releases are mostly from Poland, Germany, and Canada, with limited short-term effect on the yen or the dollar. Given timezone differences, market attention will focus more on potential Bank of Japan interventions and upcoming US data releases later in the day.
Resistance & Support
The above financial market data, quotes, charts, statistics, exchange rates, news, research, analysis, buy or sell ratings, financial education, and other information are for reference only. Before making any trades based on this information, you should consult independent professional advice to verify pricing data or obtain more detailed market information. 1uptick.com should not be regarded as soliciting any subscriber or visitor to execute any trade. You are solely responsible for all of your own trading decisions.