









 |
| Gold V.1.3.1 signal Telegram Channel (English) |
AUDUSD: Strong Rebound Confirmed with Key Support Holding Firm, July 22, 2026
2026-07-22 @ 06:01
Over the past 24 to 48 hours, the Australian Dollar against the US Dollar (AUD/USD) showed a firmer tone, closing at 0.69987 yesterday, slightly up from the previous day. The key driver was softer-than-expected US inflation data, which sharply reduced the odds of a July Federal Reserve hike to just 10%. This weighed on the US Dollar, allowing the AUD to strengthen amid improving risk appetite.
Meanwhile, the Reserve Bank of Australia (RBA) has maintained a hawkish stance, supported by robust commodity prices, which has provided solid backing for the AUD. However, ongoing geopolitical tensions, notably the 2026 US-Iran conflict stoking stagflation fears, have capped gains and restrained a stronger bullish run for the currency pair.
Overall, AUD’s recent moves have been shaped by a combination of fundamental factors favoring Australia’s monetary policy milieu and easing US tightening expectations, overlaid with shifts in global risk sentiment. For the everyday investor, understanding these dynamics—particularly the shifting US monetary policy outlook and geopolitical risk impact on market risk sentiment—can offer valuable insights to capitalize on AUD/USD volatility.
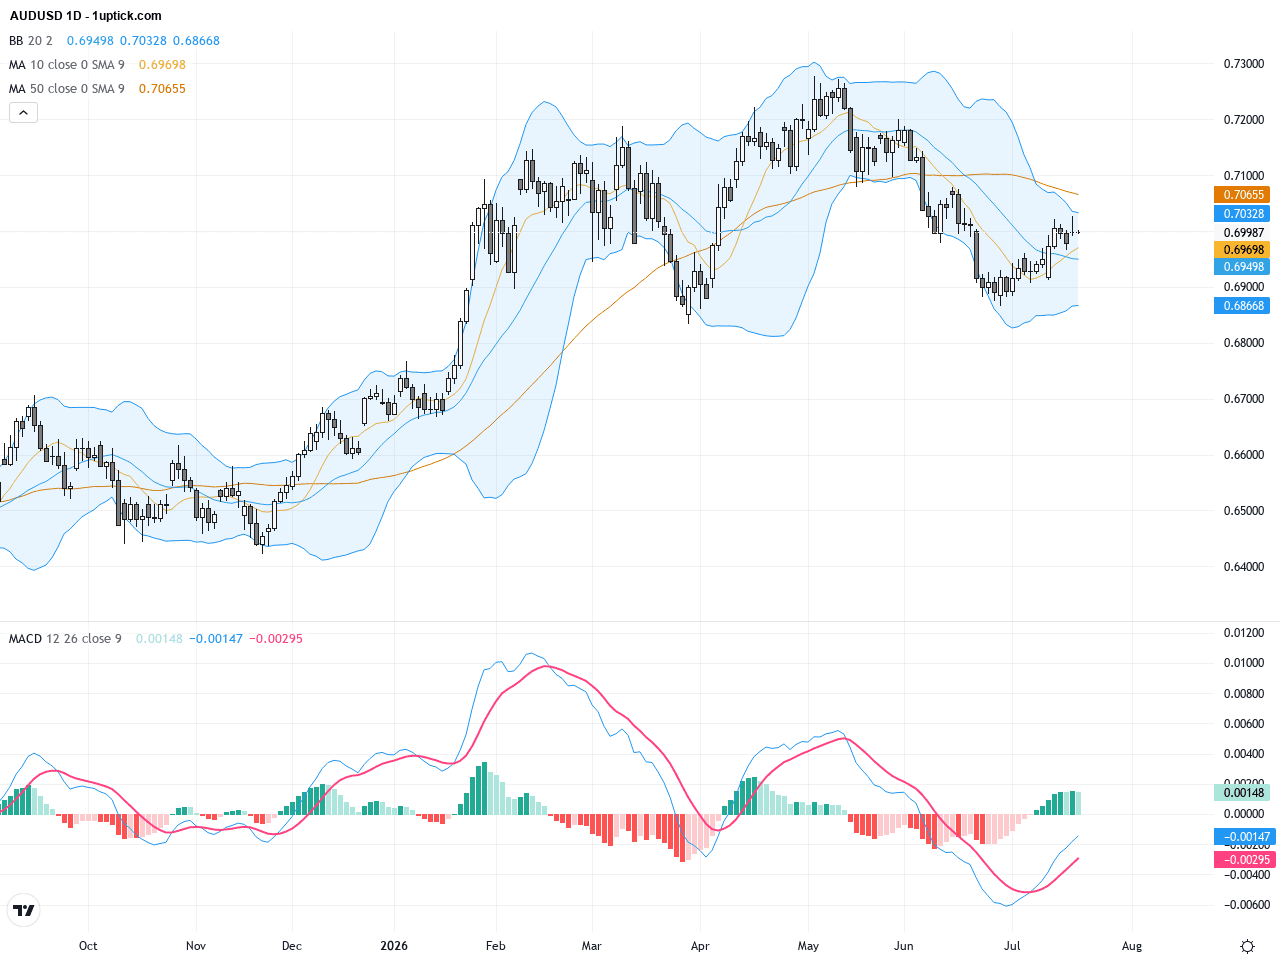
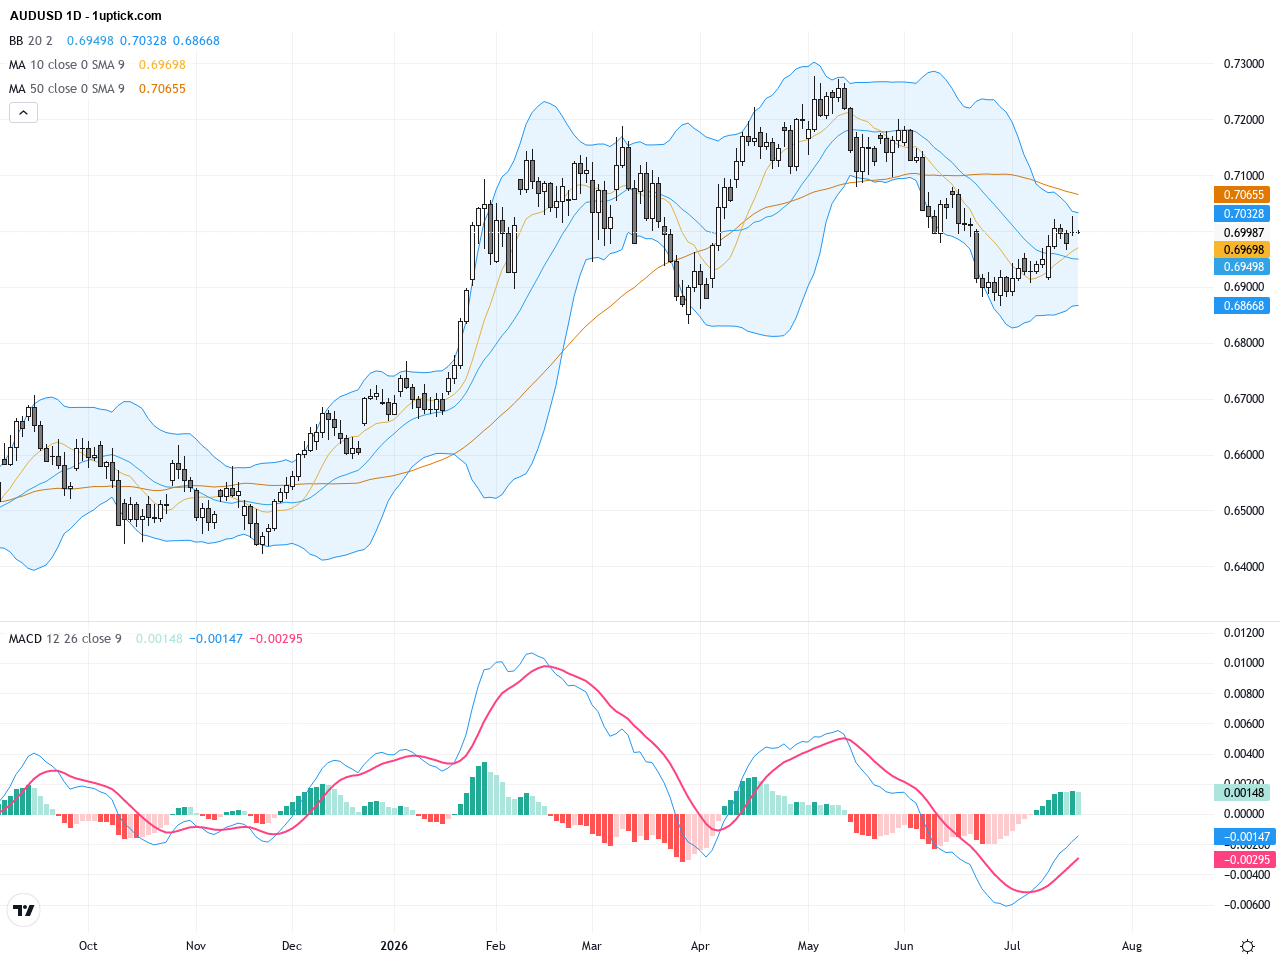
The daily chart shows AUDUSD in a sustained upward trend starting from recent lows. Price has broken above prior resistance near 0.6900 and currently hovers around the 0.7000 level. The 50-day moving average (around 0.70457) sits slightly above, signaling medium-term resistance. MACD indicates strong bullish momentum but with some divergence warning. Bollinger Bands are starting to widen after a contraction, suggesting increased volatility ahead. The long-term trend is bullish, yet caution is warranted given signs of momentum easing.
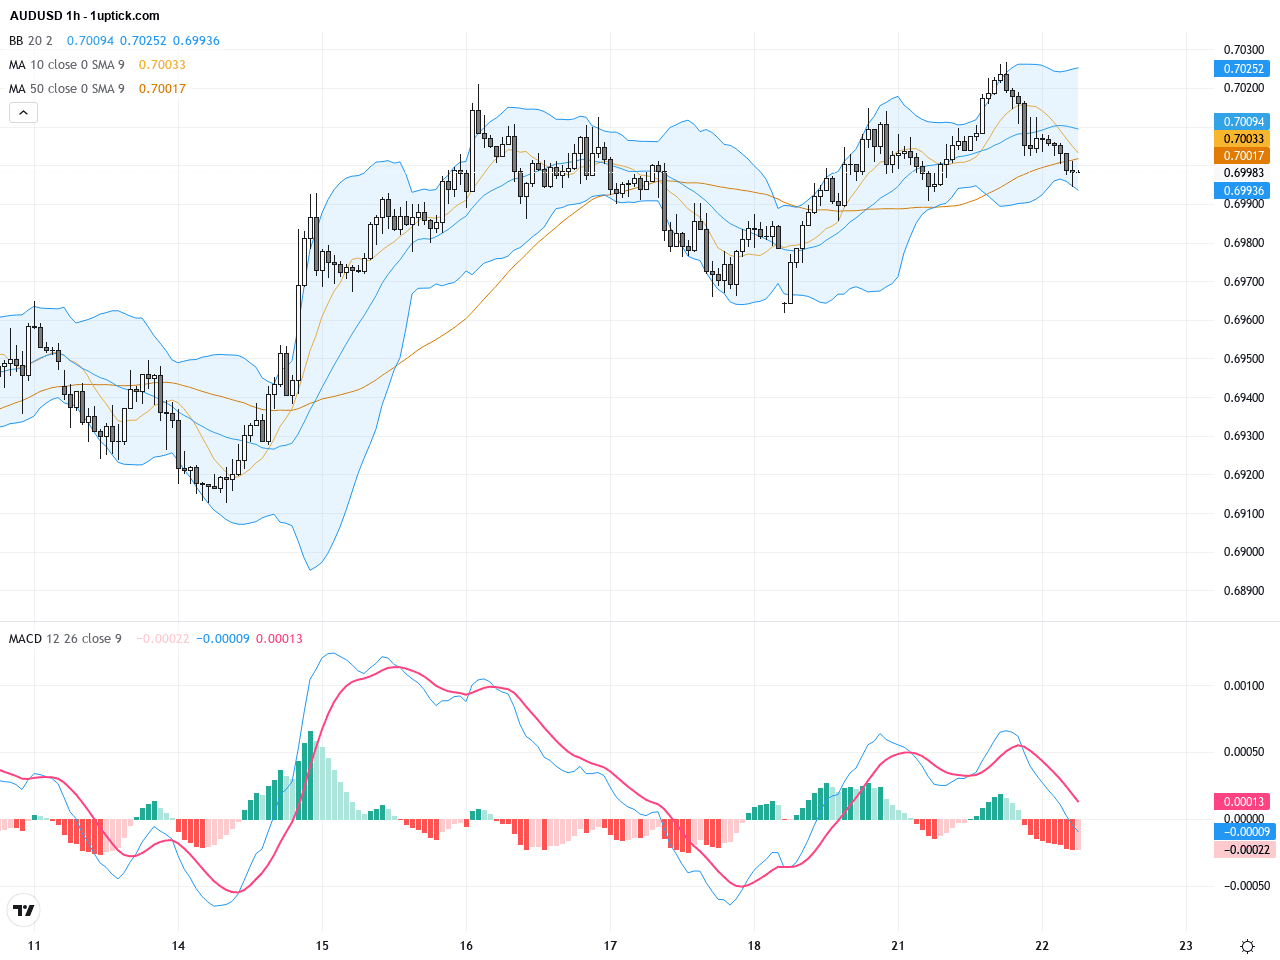
The hourly chart over the last 3-5 days reveals a stepped consolidation after a series of rallies. Price has been testing resistance between 0.6990 and 0.7030 repeatedly. Short-term moving averages align bullishly, showing short-term dominance by buyers. A recent bullish MACD crossover coupled with RSI in neutral-to-hot territory indicates ongoing upward momentum, though not without potential pullbacks. The Bollinger Bands middle band acts as solid near-term support. A recent engulfing bullish candlestick signals the bulls currently lead, suggesting short-term upside or sideways consolidation.
Technical Trend: AUDUSD is currently exhibiting a firmly bullish trend. Near-term bullish momentum persists, supported by favorable risk sentiment and technical patterns, though some deceleration in momentum calls for cautious positioning.
Technically, AUDUSD has surpassed multiple resistance levels and is currently executing a bullish impulsive sequence above the critical 0.7090 support zone. The pair shows a consistent pattern of higher highs and higher lows, supported by solid daily Bollinger Band midline support. On the hourly chart, a recent bullish engulfing pattern alongside an MACD bullish crossover reinforces near-term upside potential. Traders should watch for a break above the 50-day moving average to confirm trend continuation or potential reversal signals to manage downside risk.Today’s economic calendar does not feature any significant or direct data releases from the US or Australia that would materially impact AUDUSD. Key events include Japan’s trade figures and the UK’s inflation data, but these have limited direct correlation with the AUDUSD pair. Therefore, market movements for AUDUSD today will likely be driven by technical factors and broader risk sentiment rather than fundamental news.
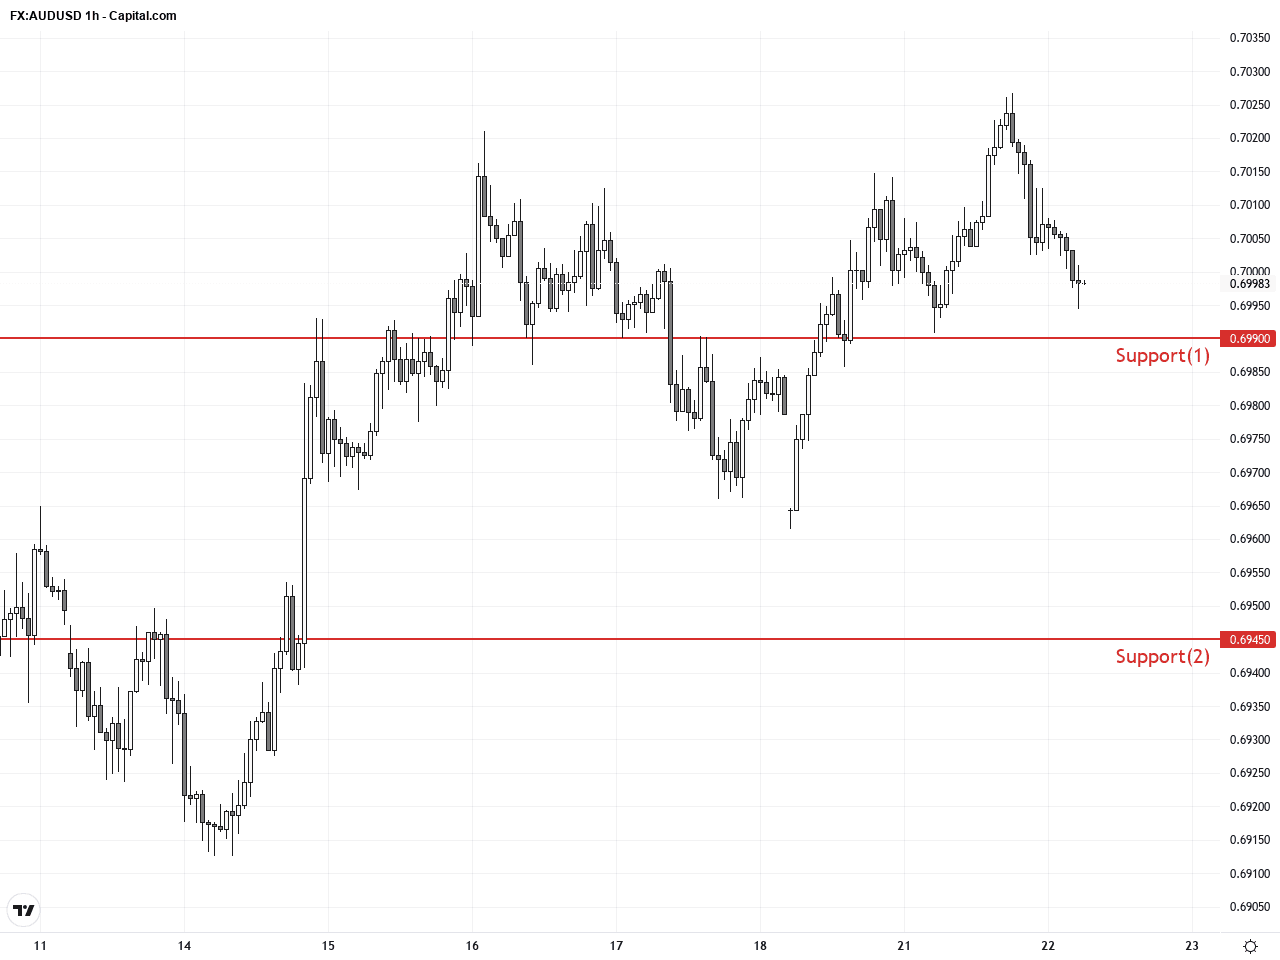
Resistance & Support
The above financial market data, quotes, charts, statistics, exchange rates, news, research, analysis, buy or sell ratings, financial education, and other information are for reference only. Before making any trades based on this information, you should consult independent professional advice to verify pricing data or obtain more detailed market information. 1uptick.com should not be regarded as soliciting any subscriber or visitor to execute any trade. You are solely responsible for all of your own trading decisions.